Fig. 3.
Download original image
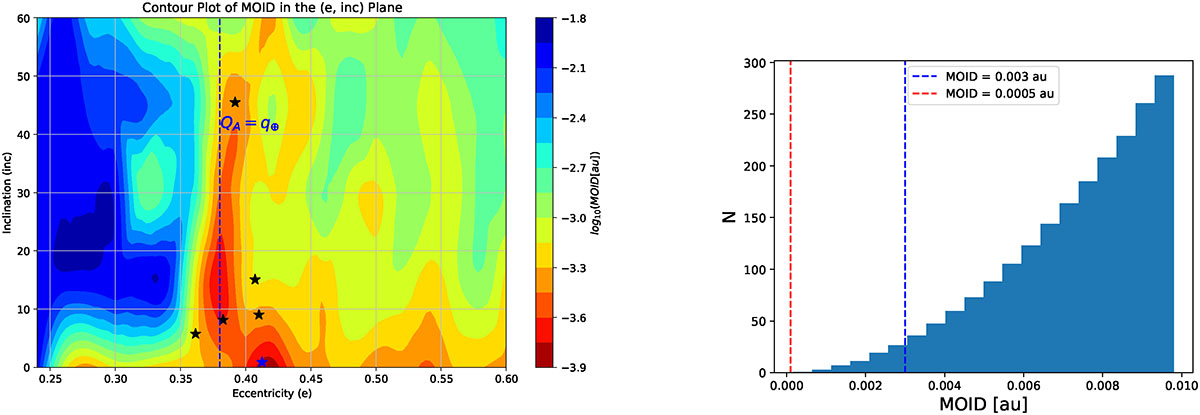
Left panel: MOID contour map with Earth as a function of the initial values of (e, i). The vertical line shows e = 0.38, where the Earth’s pericenter and the apocenter of the Venus co-orbital asteroid are equal. Co-orbitals of Venus with a MOID of 0.0005 au or less are shown by the black stars. The orbital position of 2025 TV10 is shown by the blue star. Reproduced with permission from Fig. 7 of Carruba et al. (2025b). Right panel: Histogram of MOID values with Earth for clones of 2025 TV10. The vertical lines display the regions of large (blue line) and high (red line) collision risks.
Current usage metrics show cumulative count of Article Views (full-text article views including HTML views, PDF and ePub downloads, according to the available data) and Abstracts Views on Vision4Press platform.
Data correspond to usage on the plateform after 2015. The current usage metrics is available 48-96 hours after online publication and is updated daily on week days.
Initial download of the metrics may take a while.