Fig. 2.
Download original image
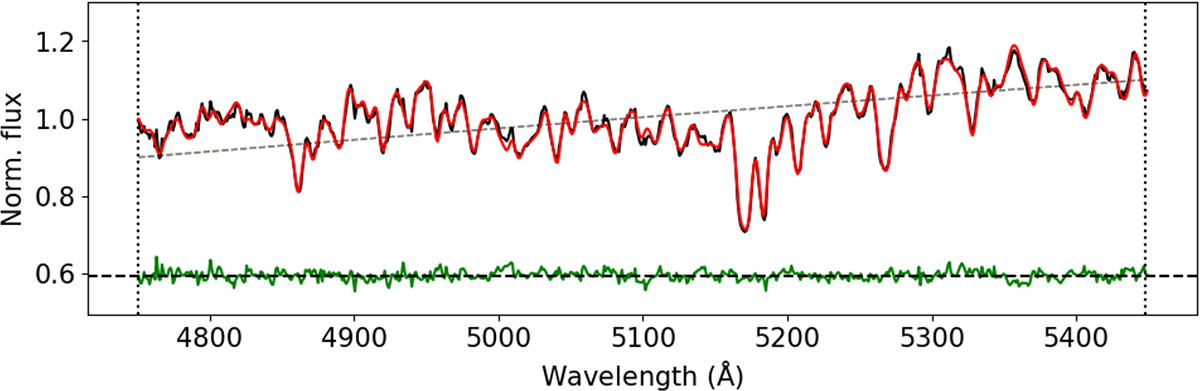
Spectrum fitted with BAYES-LOSVD. The x-axis represents the rest-frame wavelength in Å. The y-axis shows the normalized flux. The modelled spectrum (red) closely matches the observed spectrum (black) with minimal residuals (green). Dashed lines show the continuum level of the spectrum and residual, and dotted vertical lines enclose the fitted wavelength region.
Current usage metrics show cumulative count of Article Views (full-text article views including HTML views, PDF and ePub downloads, according to the available data) and Abstracts Views on Vision4Press platform.
Data correspond to usage on the plateform after 2015. The current usage metrics is available 48-96 hours after online publication and is updated daily on week days.
Initial download of the metrics may take a while.