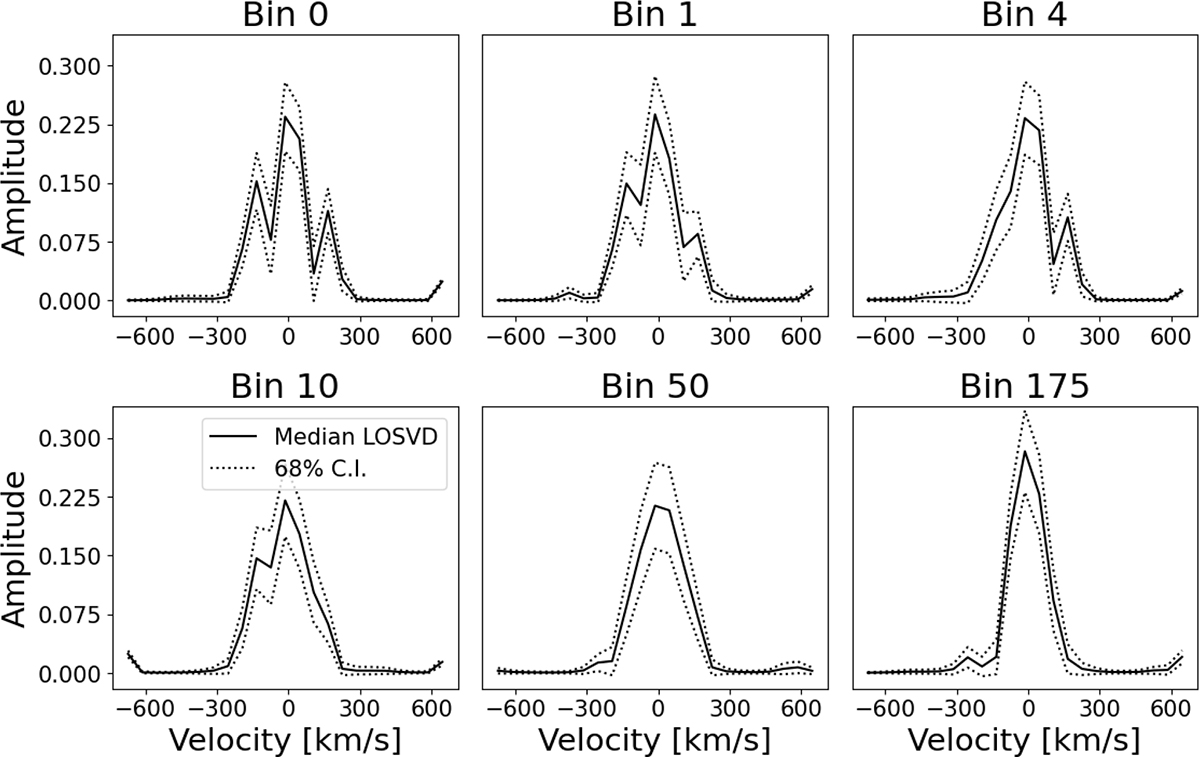
Fig. 3.
Download original image
LOSVDs extracted with BAYES-LOSVD. Solid lines denote the median LOSVD, the dotted lines the 68% confidence intervals. Each panel shows a different spatial bin of the MUSE data. Bins 0, 1, 4 and 10 are likely dominated by the NSC based on their central location and kinematic features. The position of each bin in the field is shown in Fig. 4.
Current usage metrics show cumulative count of Article Views (full-text article views including HTML views, PDF and ePub downloads, according to the available data) and Abstracts Views on Vision4Press platform.
Data correspond to usage on the plateform after 2015. The current usage metrics is available 48-96 hours after online publication and is updated daily on week days.
Initial download of the metrics may take a while.