Fig. 4.
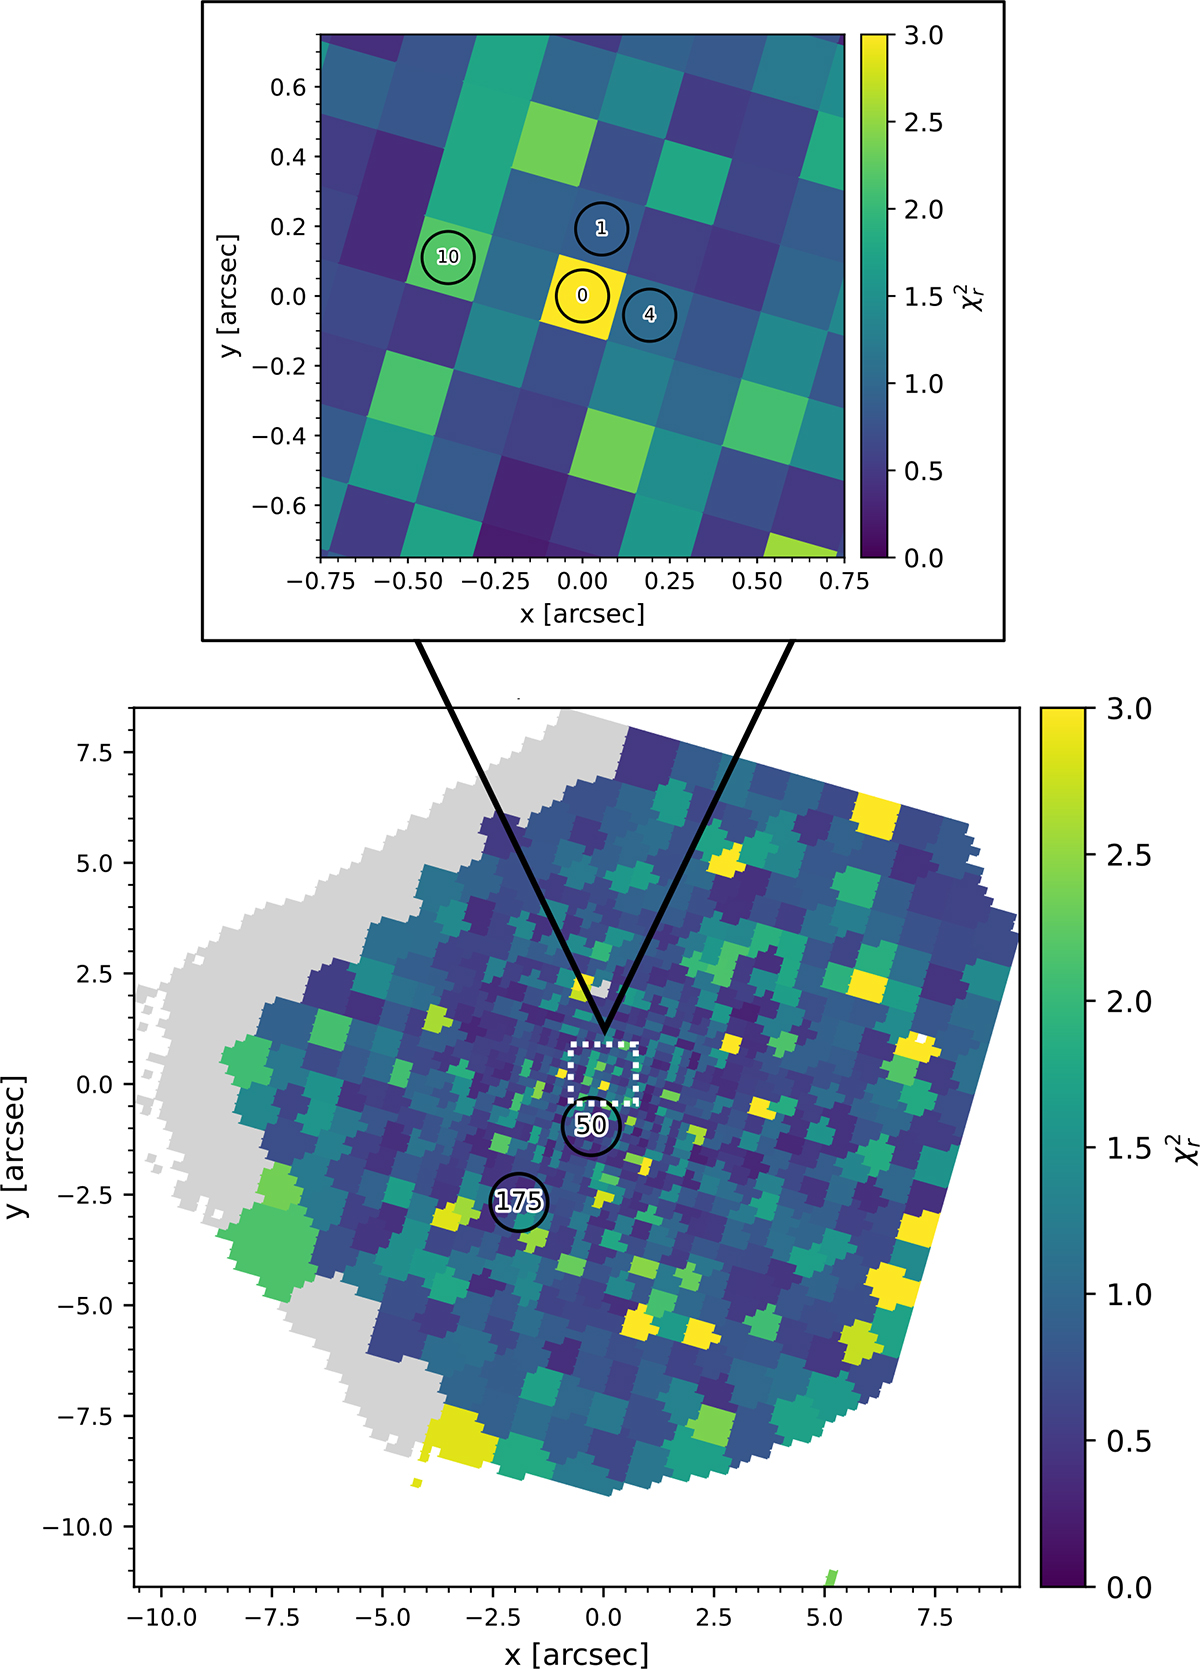
Download original image
Reduced χ2 map of the explored parameter space. The colour scale indicates the relative goodness of the fit, with darker shades corresponding to lower χ2 values. Bottom: reduced χ2 map over the entire ∼15″ × 15″ field. Masked bins are coloured grey. We highlight the position of the spatial bins 50 and 175, whose LOSVD histograms are shown in Fig. 3. Top: zoom-in into the nuclear region. We highlight the position of the spatial bins 0,1,4 and 10, whose LOSVD histograms are shown in Fig. 3.
Current usage metrics show cumulative count of Article Views (full-text article views including HTML views, PDF and ePub downloads, according to the available data) and Abstracts Views on Vision4Press platform.
Data correspond to usage on the plateform after 2015. The current usage metrics is available 48-96 hours after online publication and is updated daily on week days.
Initial download of the metrics may take a while.