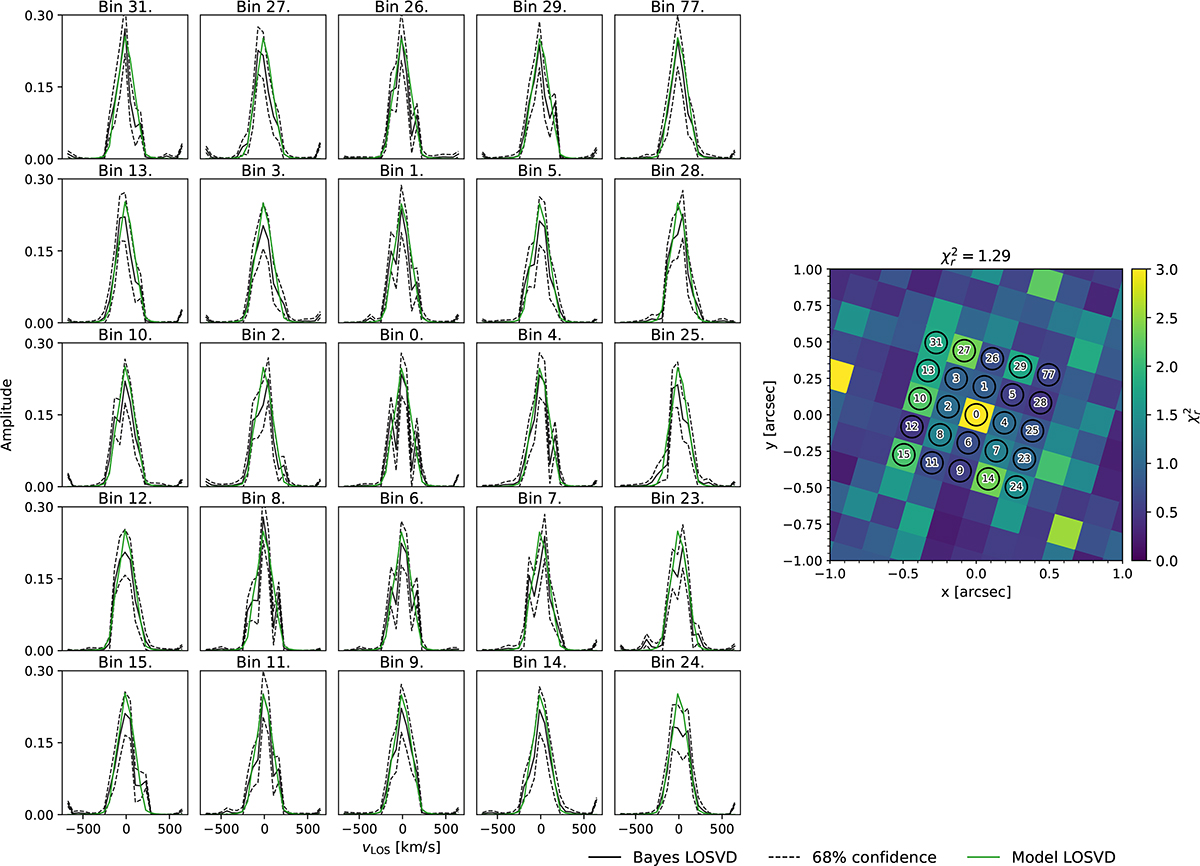
Fig. A.1.
Download original image
Left: Comparison between the measured Bayes-LOSVDs (in black) and the corresponding weighted model LOSVDs from DYNAMITE (in green) for the central 5 × 5 spatial bins. The dashed black lines display the 68% confidence interval. Right: Reduced χ2 map of the nuclear region, highlighting the bins that are the most likely affected or dominated by the NSC.
Current usage metrics show cumulative count of Article Views (full-text article views including HTML views, PDF and ePub downloads, according to the available data) and Abstracts Views on Vision4Press platform.
Data correspond to usage on the plateform after 2015. The current usage metrics is available 48-96 hours after online publication and is updated daily on week days.
Initial download of the metrics may take a while.