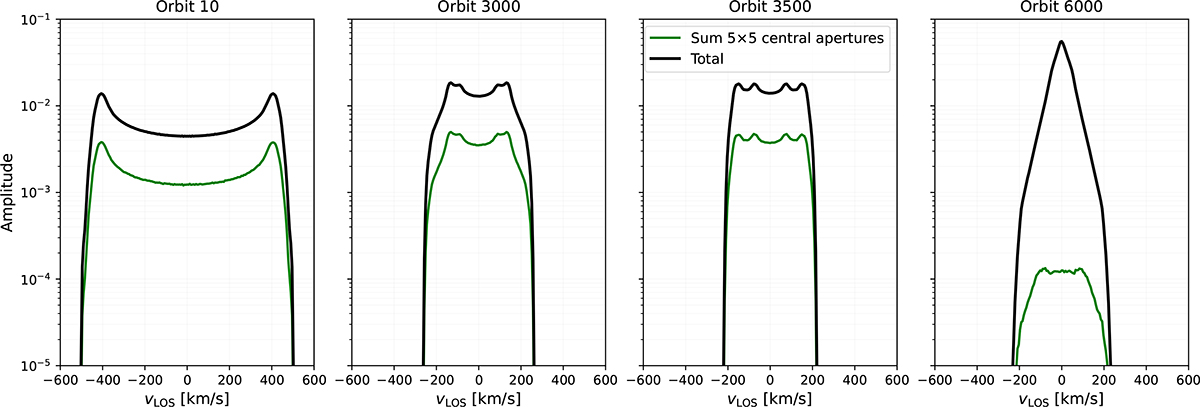
Fig. A.2.
Download original image
Example LOSVDs of four representative orbits from the dynamical model. The black curves show the LOSVD of each orbit across all apertures, while the green curves correspond to the summed contribution of the central 5 × 5 apertures to the orbit LOSVD. Although some orbits exhibit bimodal structures, the weighted sum of the orbit LOSVDs does not reproduce the pronounced multi-peaked features observed in the BAYES-LOSVDS, see Fig. A.1.
Current usage metrics show cumulative count of Article Views (full-text article views including HTML views, PDF and ePub downloads, according to the available data) and Abstracts Views on Vision4Press platform.
Data correspond to usage on the plateform after 2015. The current usage metrics is available 48-96 hours after online publication and is updated daily on week days.
Initial download of the metrics may take a while.