Open Access
Fig. 5
Download original image
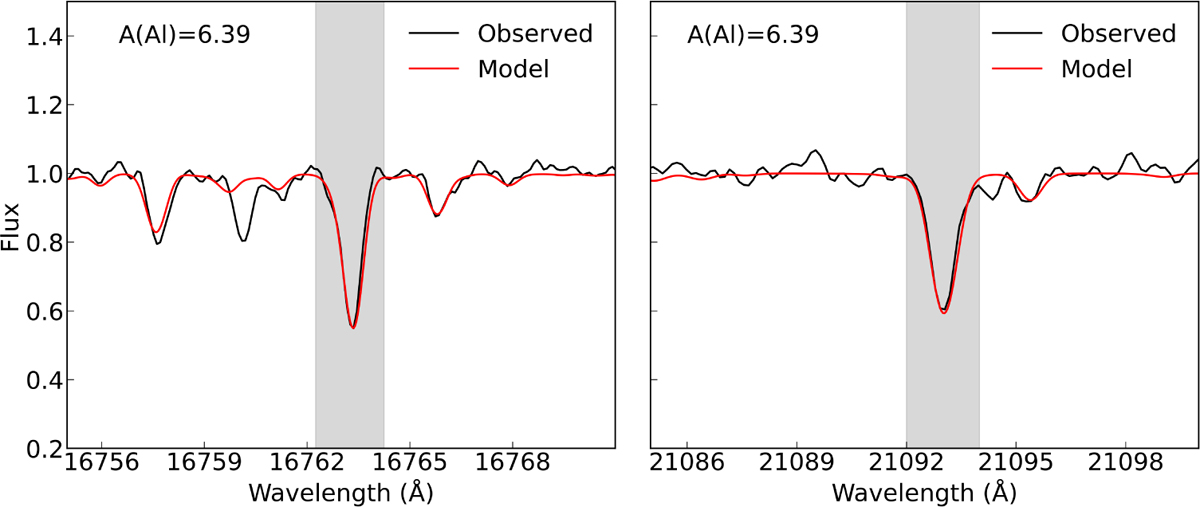
Comparison of synthetic spectra (red lines) to the observed spectra (black line) for a Patchick 126 star, Star 1. Each panel shows the best-determined (grey-shaded region) [Al/Fe] abundance ratios for a representative line in the H and K bands, at 16763.4 Å and 21093.0 Å, respectively.
Current usage metrics show cumulative count of Article Views (full-text article views including HTML views, PDF and ePub downloads, according to the available data) and Abstracts Views on Vision4Press platform.
Data correspond to usage on the plateform after 2015. The current usage metrics is available 48-96 hours after online publication and is updated daily on week days.
Initial download of the metrics may take a while.