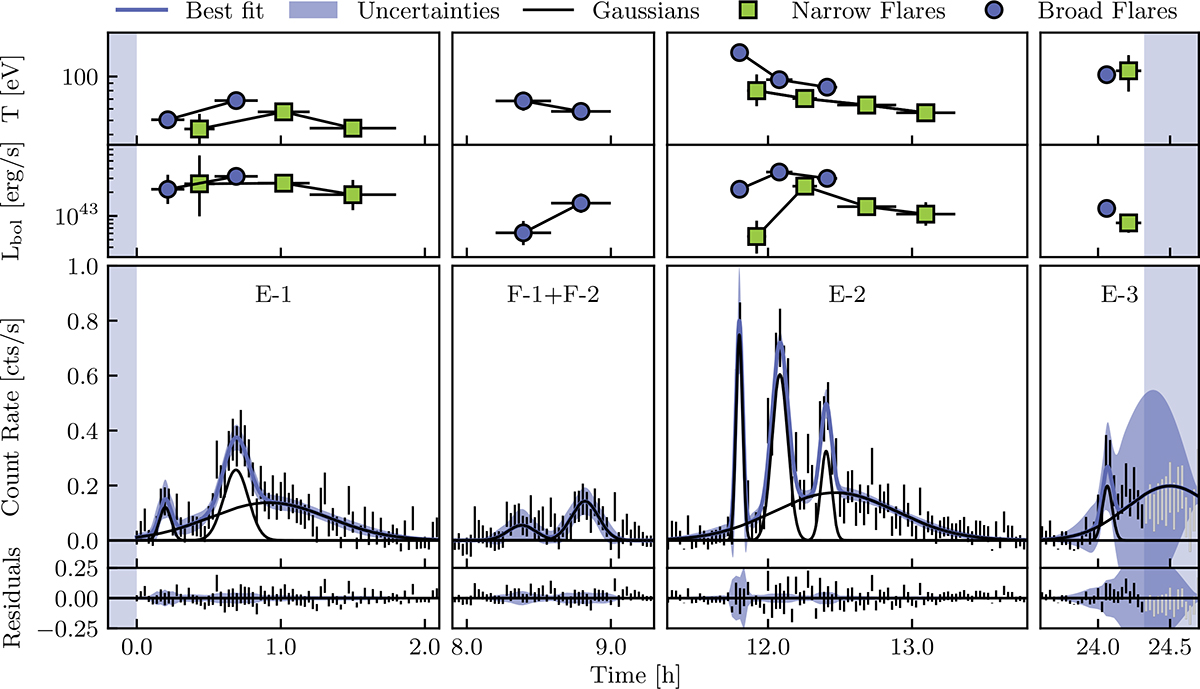
Fig. 2.
Download original image
Best fit of the XMM-Newton flare profiles. We do not find significant evidence of asymmetry; therefore, we use Gaussian functions. In the top two panels, we show the temperature and bolometric luminosity evolution along the flares, derived from time-resolved spectral analysis. The blue points correspond to data extracted during the short-time flares, while the green points trace the evolution of the broad underlying flares.
Current usage metrics show cumulative count of Article Views (full-text article views including HTML views, PDF and ePub downloads, according to the available data) and Abstracts Views on Vision4Press platform.
Data correspond to usage on the plateform after 2015. The current usage metrics is available 48-96 hours after online publication and is updated daily on week days.
Initial download of the metrics may take a while.