Open Access
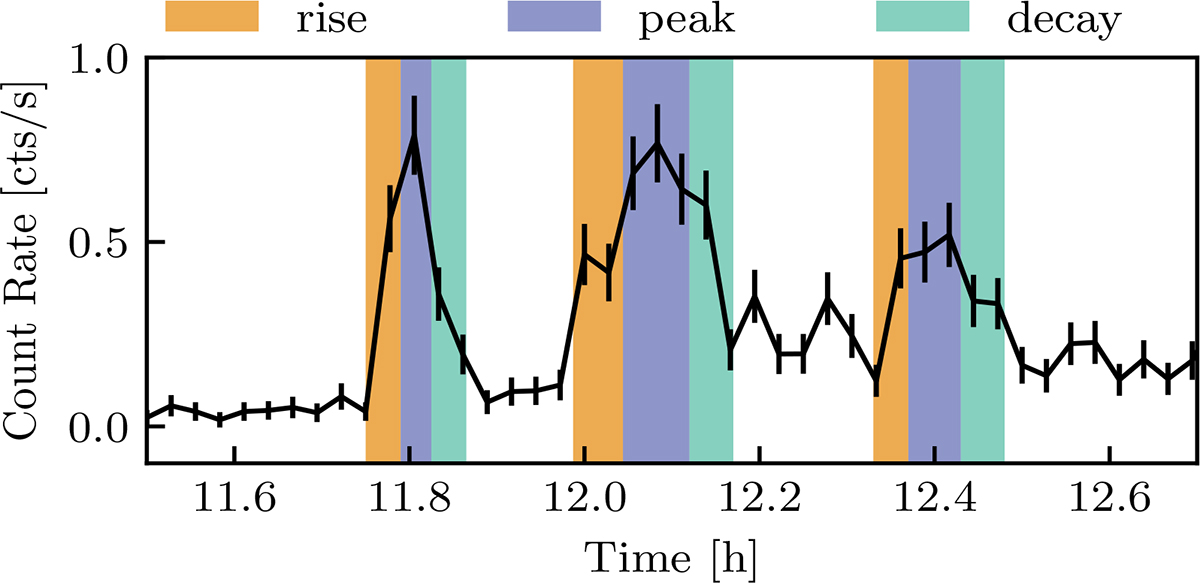
Fig. C.2.
Download original image
Different time bins extracted in order to model the rise peak and decay phases of the narrow flares in E-2. Areas corresponding to the same color were extracted and analyzed jointly.
Current usage metrics show cumulative count of Article Views (full-text article views including HTML views, PDF and ePub downloads, according to the available data) and Abstracts Views on Vision4Press platform.
Data correspond to usage on the plateform after 2015. The current usage metrics is available 48-96 hours after online publication and is updated daily on week days.
Initial download of the metrics may take a while.