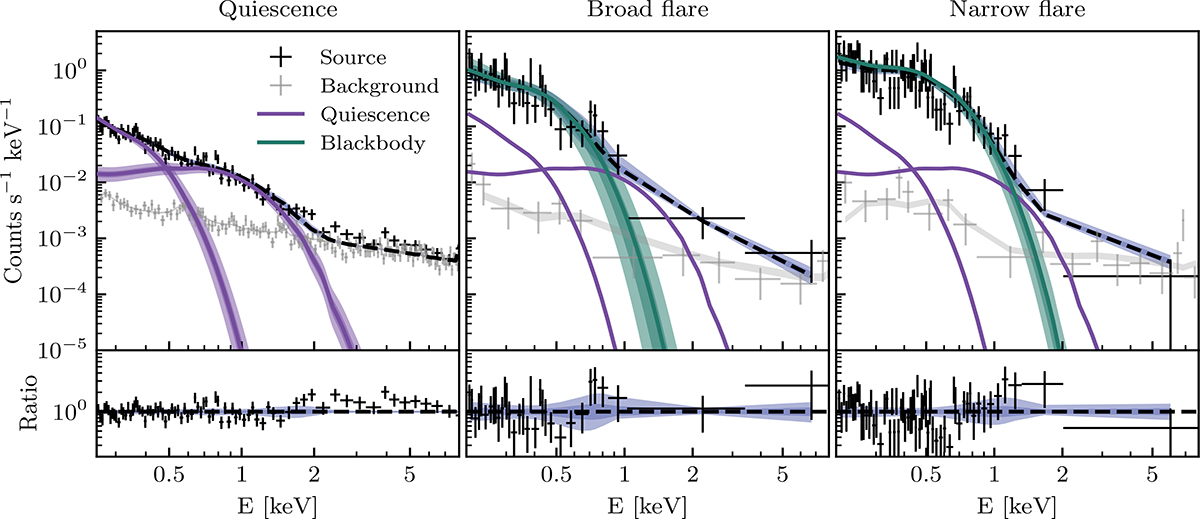
Fig. C.3.
Download original image
Example spectra and residuals of three states of J2344. The first panel shows the quiescence spectrum, the second a spectrum extracted in a phase where only the broad flare is detected (phase b of E-2), and the third panel shows the spectrum of the second flare in E-2 (phase c). The purple lines indicate the quiescence double-blackbody model. In the first panel, we also show the 1 and 2 σ uncertainty bands. The green line (and respective uncertainty bands) represents the additional blackbody used to model the flares. The dashed black line and blue uncertainty bands represent the total model, which also includes the background (gray band). The black and gray markers are, respectively, source and background spectral bins.
Current usage metrics show cumulative count of Article Views (full-text article views including HTML views, PDF and ePub downloads, according to the available data) and Abstracts Views on Vision4Press platform.
Data correspond to usage on the plateform after 2015. The current usage metrics is available 48-96 hours after online publication and is updated daily on week days.
Initial download of the metrics may take a while.