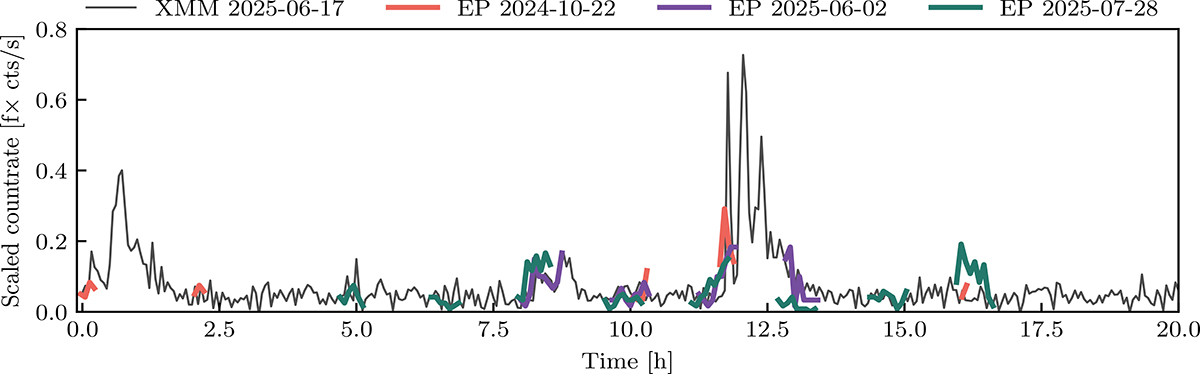
Fig. D.2.
Download original image
Comparison of the XMM newton and EP light curves. The X-axis refers to time since the start of the XMM-Newton observations. The EP light curves are rescaled by a factor 2.5 in order for the y-axes to be comparable across different instruments. The green curve shows at least one flare that cannot be matched to features observed in the XMM-Newton light curve.
Current usage metrics show cumulative count of Article Views (full-text article views including HTML views, PDF and ePub downloads, according to the available data) and Abstracts Views on Vision4Press platform.
Data correspond to usage on the plateform after 2015. The current usage metrics is available 48-96 hours after online publication and is updated daily on week days.
Initial download of the metrics may take a while.