Fig. 4
Download original image
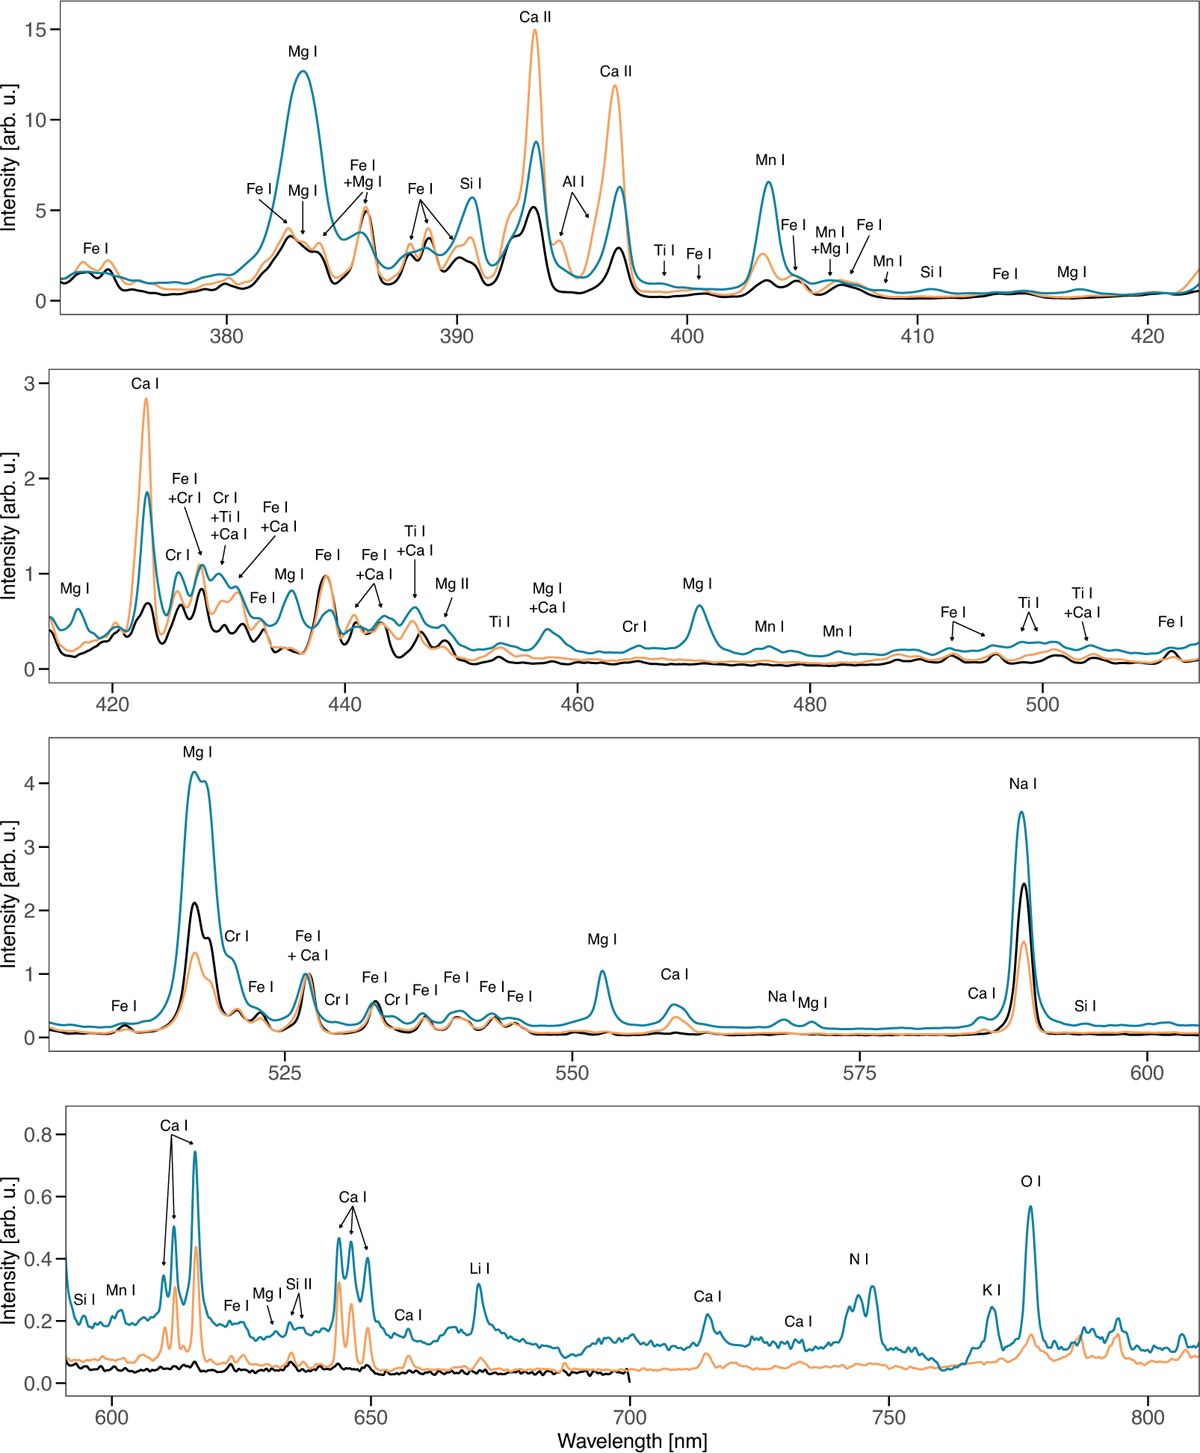
Comparison of the spectra of the two achondrites - the aubrite candidate (ACH1; in blue) and the eucrite candidate (ACH2; in orange) - with a typical ordinary-chondrite-like spectrum (black). The plots are split into separate wavelength ranges for better visibility, with intensities normalized to unity at the peak of the Fe I line at ≈527 nm. The aubrite candidate spectrum includes a more notable continuum and faint molecular bands of N2, which can be seen in the bottom two panels.
Current usage metrics show cumulative count of Article Views (full-text article views including HTML views, PDF and ePub downloads, according to the available data) and Abstracts Views on Vision4Press platform.
Data correspond to usage on the plateform after 2015. The current usage metrics is available 48-96 hours after online publication and is updated daily on week days.
Initial download of the metrics may take a while.