Open Access
Fig. 5
Download original image
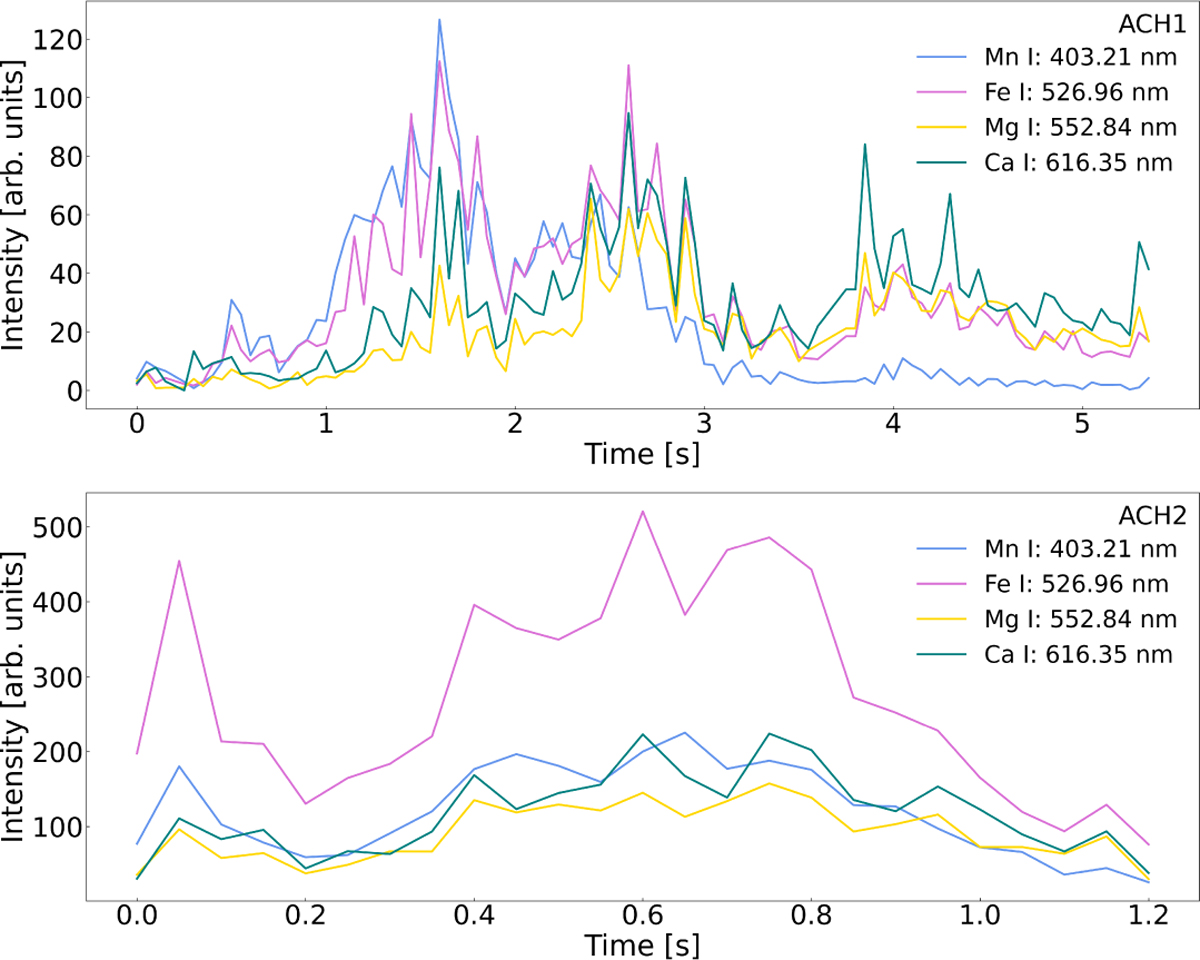
Monochromatic light curves of the two candidate achondrites: ACH1 (upper panel) and ACH2 (lower panel), comparing the time-resolved emission of selected species, Mg I, Fe I, Mn I, and Ca I, based on selected well-resolved spectral lines. The time on the x-axis begins from the first recorded frame of the meteor spectrum.
Current usage metrics show cumulative count of Article Views (full-text article views including HTML views, PDF and ePub downloads, according to the available data) and Abstracts Views on Vision4Press platform.
Data correspond to usage on the plateform after 2015. The current usage metrics is available 48-96 hours after online publication and is updated daily on week days.
Initial download of the metrics may take a while.