Fig. 7
Download original image
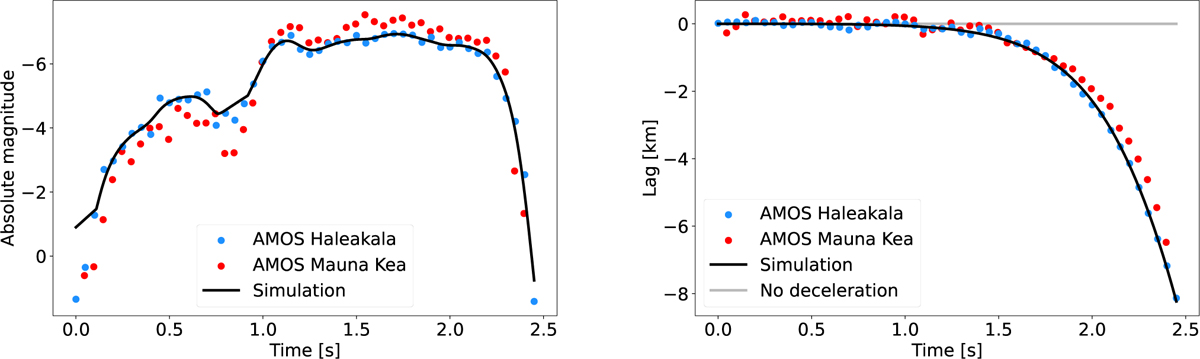
Final simultaneous fit of the light curve (left panel) and the deceleration profile (right panel) of the eucrite candidate based on the model of meteoroid erosion. The simulation is fitted to the Haleakala data, which are more precise because this station was closer to the meteor. Lag is defined as the difference between the distance traveled by the observed meteor and the distance traveled by a fictitious non-decelerating meteor.
Current usage metrics show cumulative count of Article Views (full-text article views including HTML views, PDF and ePub downloads, according to the available data) and Abstracts Views on Vision4Press platform.
Data correspond to usage on the plateform after 2015. The current usage metrics is available 48-96 hours after online publication and is updated daily on week days.
Initial download of the metrics may take a while.