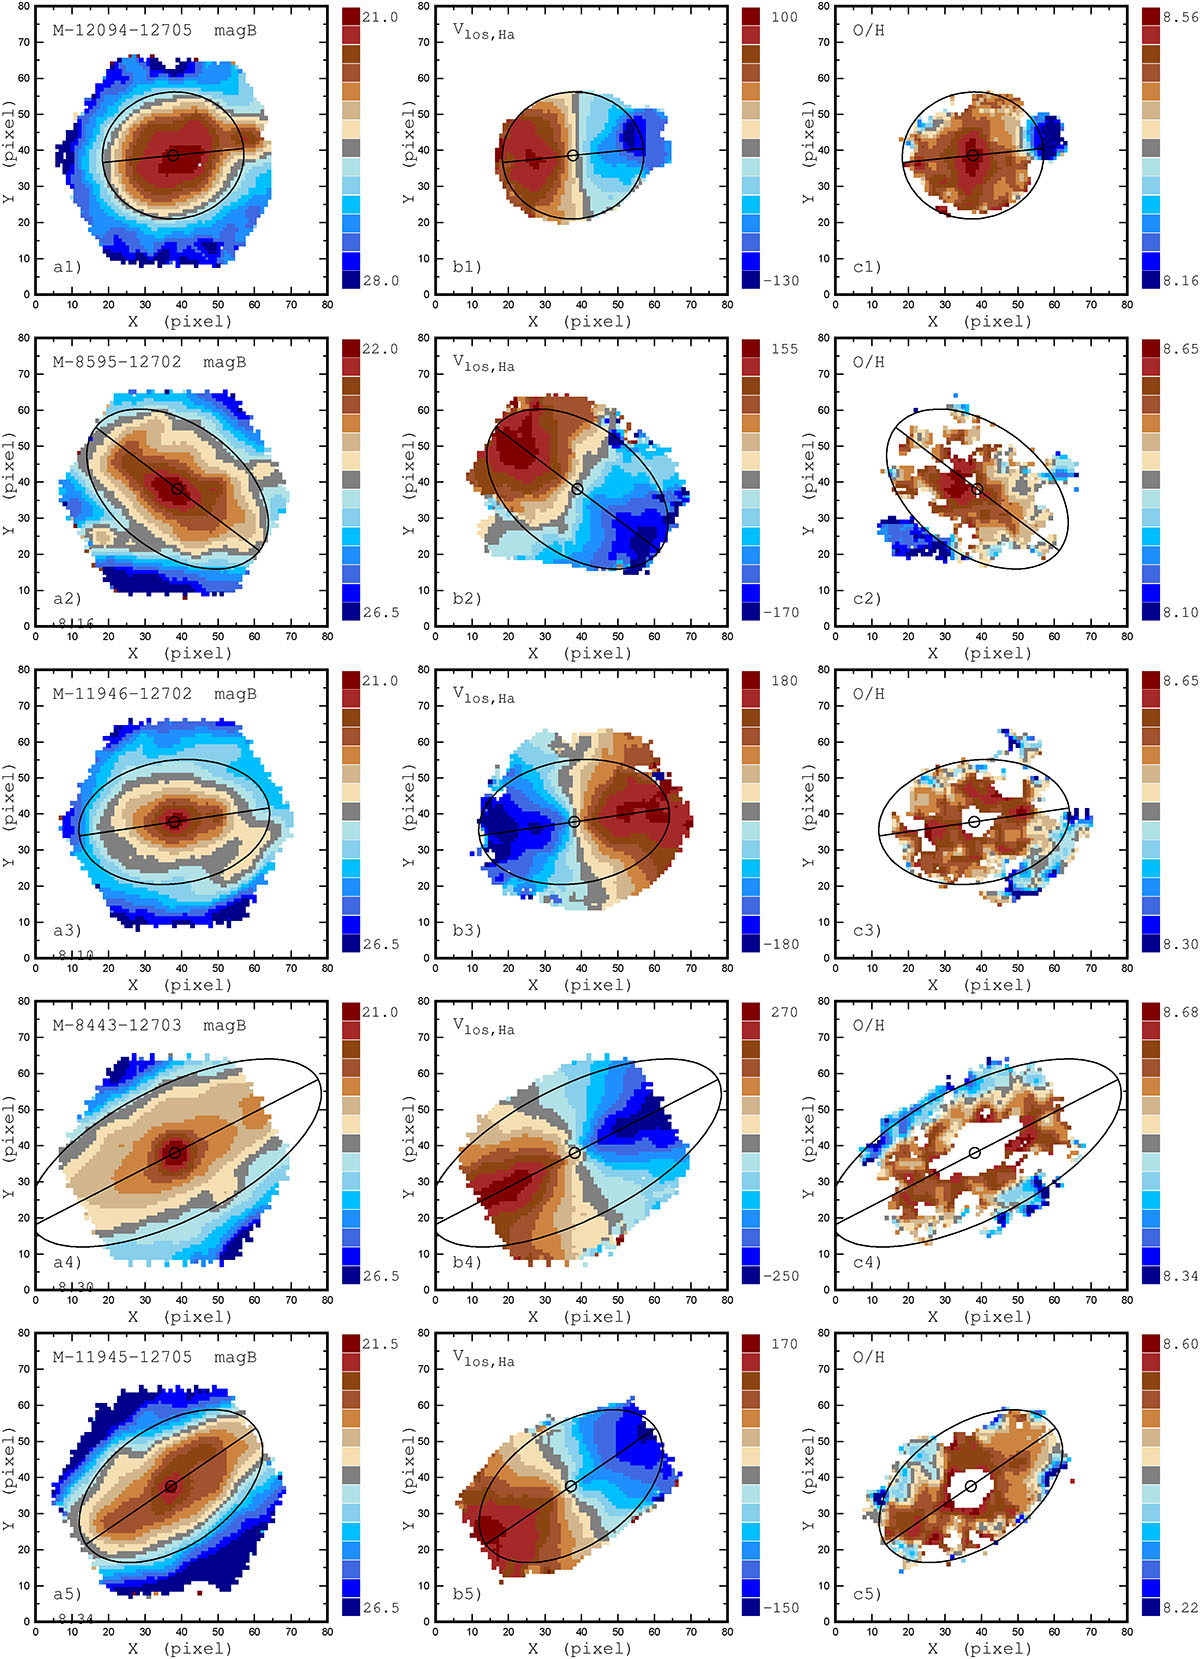
Fig. 4.
Download original image
Characteristics maps for five galaxies. Panels of the left column a: Observed surface brightness distribution in the galaxy image in sky coordinates (pixels). The surface brightness value is colour-coded. The circle shows the kinematic centre of the galaxy, the line indicates the position of the major kinematic axis of the galaxy, and the ellipse is its optical radius. Panels of the middle column b: Line-of-sight velocity field. Panels of the right column c: Distribution of O/H in the galaxy image.
Current usage metrics show cumulative count of Article Views (full-text article views including HTML views, PDF and ePub downloads, according to the available data) and Abstracts Views on Vision4Press platform.
Data correspond to usage on the plateform after 2015. The current usage metrics is available 48-96 hours after online publication and is updated daily on week days.
Initial download of the metrics may take a while.