Fig. A.2
Download original image
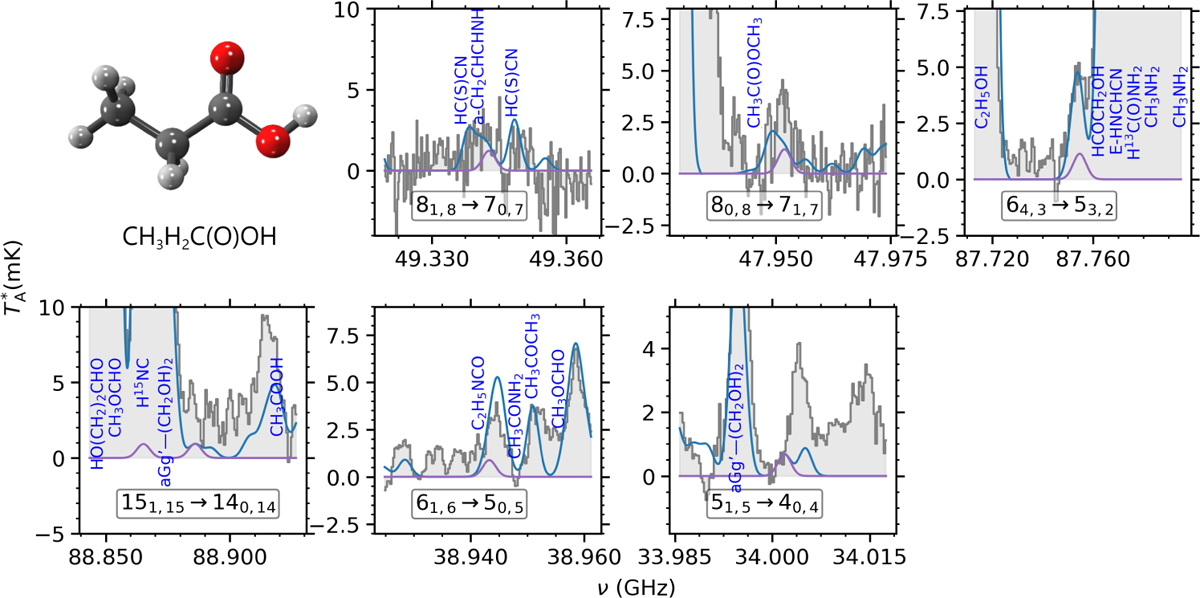
LTE simulation of the propionic acid, CH3CH2C(O)OH, emission using the upper limit column density derived toward G+0.693 (in purple) together with the expected molecular emission from all the molecular species identified to date in our survey (in blue), both overlaid on the observations (gray histogram). The quantum numbers for each transition are shown at the bottom of each panel.
Current usage metrics show cumulative count of Article Views (full-text article views including HTML views, PDF and ePub downloads, according to the available data) and Abstracts Views on Vision4Press platform.
Data correspond to usage on the plateform after 2015. The current usage metrics is available 48-96 hours after online publication and is updated daily on week days.
Initial download of the metrics may take a while.