Fig. 3
Download original image
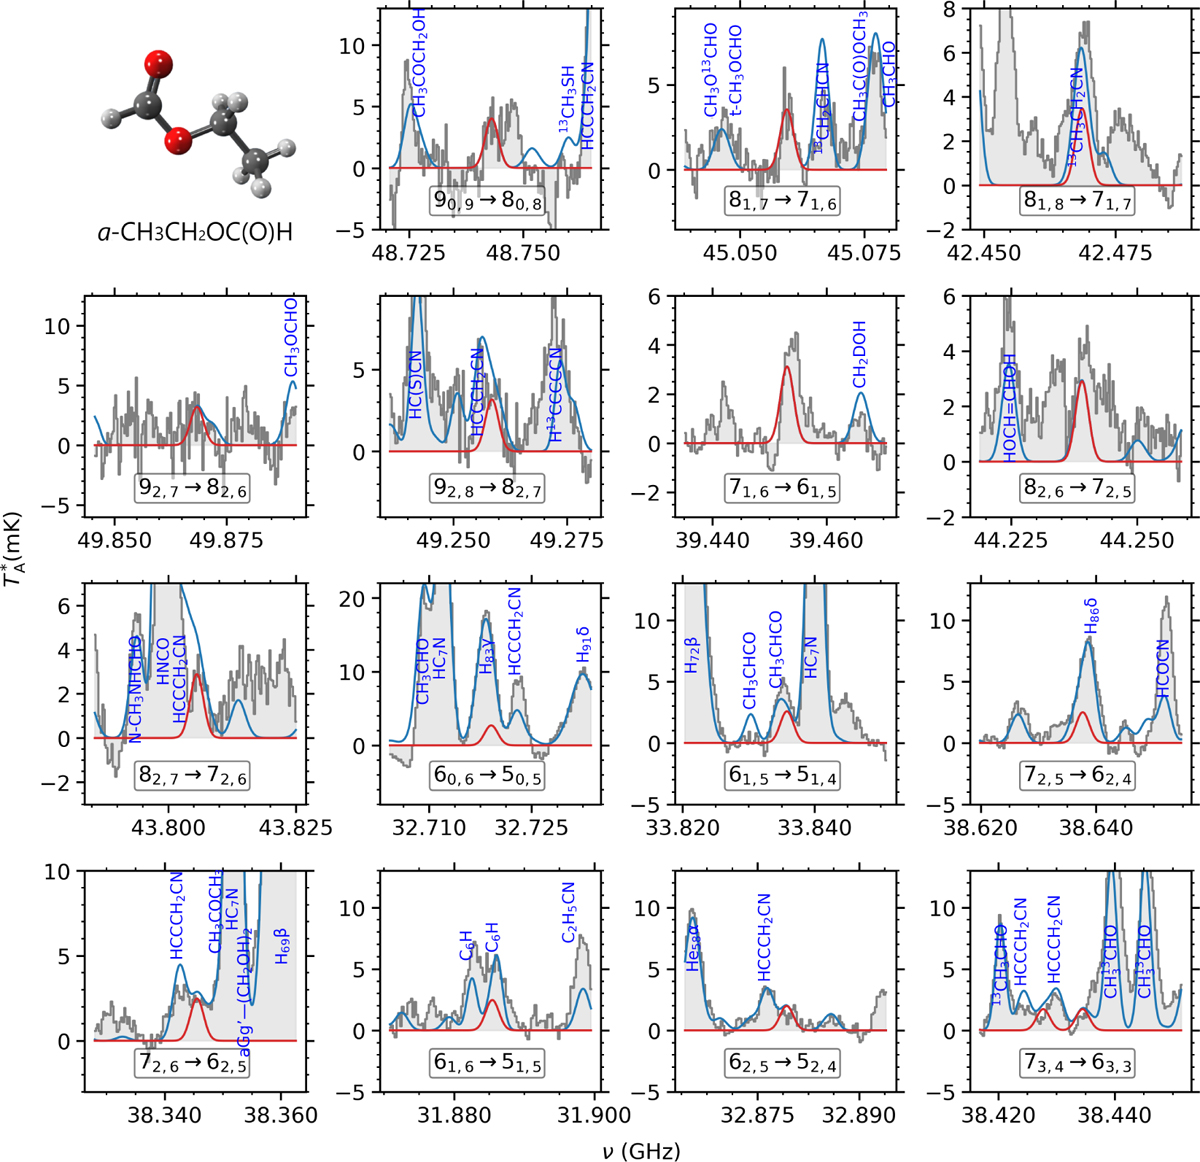
Transitions of a-ethyl formate, a-CH3CH2OC(O)H, identified toward G+0.693, which were used to derive the LTE physical parameters of the molecule (see text; listed in Table A.2). The red line shows the best LTE fit of a-CH3CH2OC(O)H, while the blue line represents the combined emission of all molecules identified in the survey, including a-CH3CH2OC(O)H (observed spectra are shown as gray histograms). The quantum numbers for each transition are shown at the bottom of each panel. The transitions are sorted by decreasing intensity. The molecular structure of a-CH3CH2OC(O)H is also shown (C atoms in gray, O atoms in red, and H atoms in white).
Current usage metrics show cumulative count of Article Views (full-text article views including HTML views, PDF and ePub downloads, according to the available data) and Abstracts Views on Vision4Press platform.
Data correspond to usage on the plateform after 2015. The current usage metrics is available 48-96 hours after online publication and is updated daily on week days.
Initial download of the metrics may take a while.