Fig. A.1
Download original image
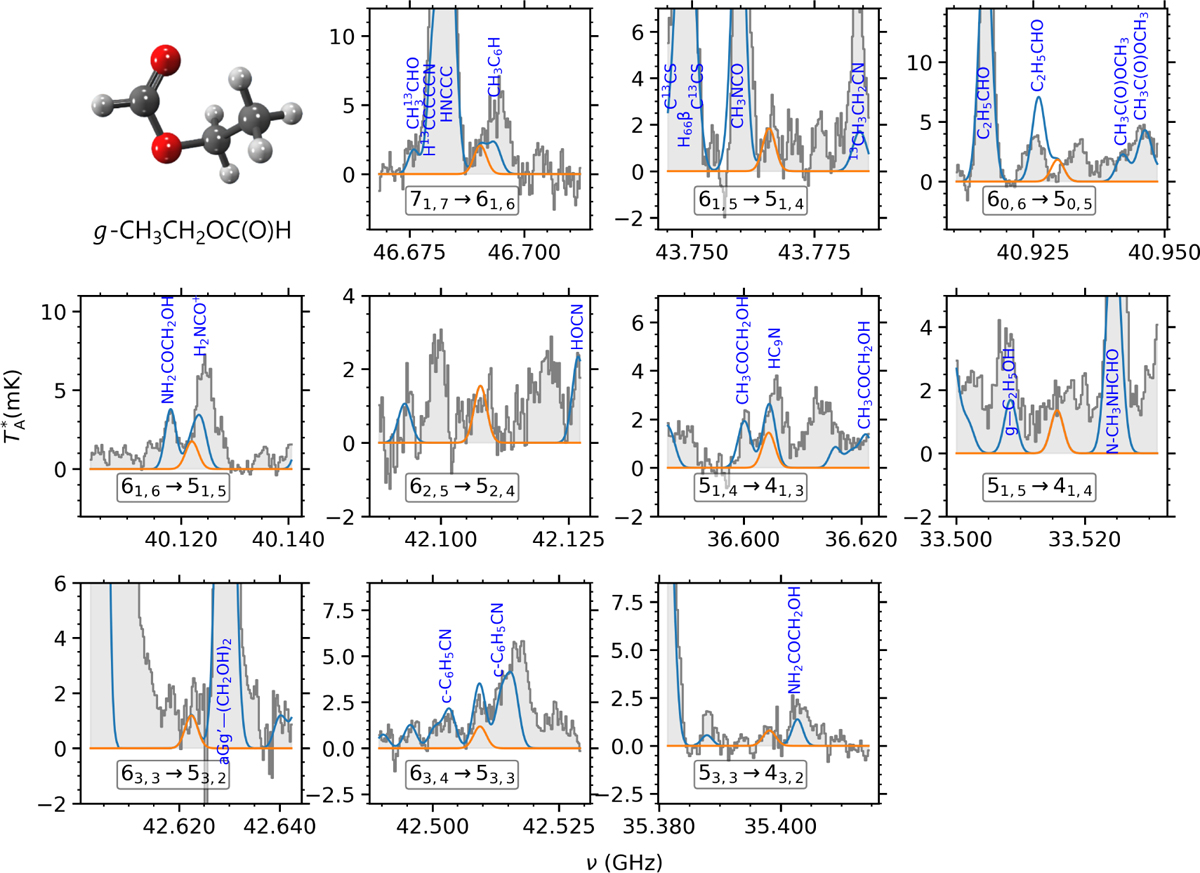
Tentative detection of g-ethyl formate, g-CH3CH2OC(O)H, toward G+0.693. The selected transitions are sorted by decreasing intensity and listed in Table A.3. The result of the LTE model of the g-CH3CH2OC(O)H emission is shown in orange, together with the expected molecular emission from all the molecular species identified to date in our survey, including g-CH3CH2OC(O)H (in blue), both overlaid on the observations (gray histogram). The molecular structure of g-CH3CH2OC(O)H is also shown (C atoms in gray, O atoms in red and H atoms in white).
Current usage metrics show cumulative count of Article Views (full-text article views including HTML views, PDF and ePub downloads, according to the available data) and Abstracts Views on Vision4Press platform.
Data correspond to usage on the plateform after 2015. The current usage metrics is available 48-96 hours after online publication and is updated daily on week days.
Initial download of the metrics may take a while.