Fig. A.1.
Download original image
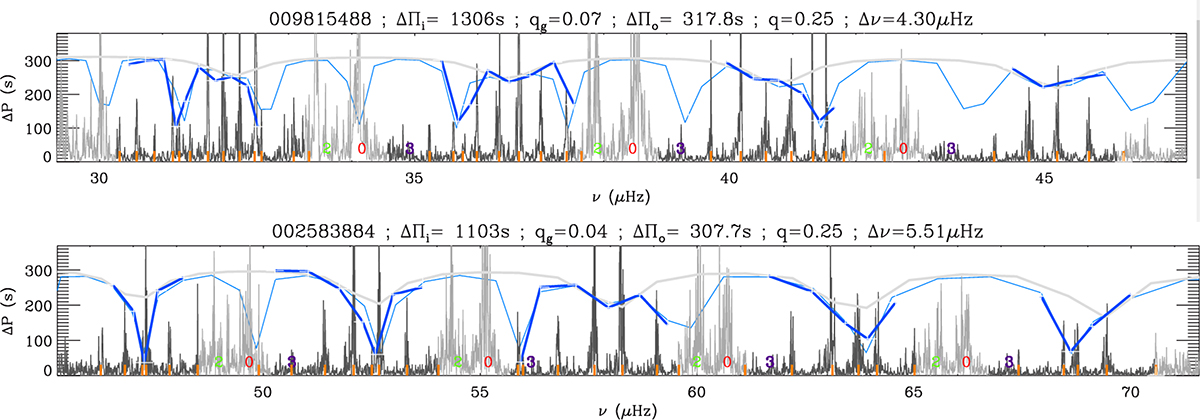
Period spacings in the oscillation spectrum of two HeCB stars, in the red clump (KIC 9815488, top) or the secondary clump (KIC 2583884, bottom). The gray curve indicates the expected period spacings for usual two-cavity mixed modes; the light blue curve corresponds to the three-cavity case. The dark blue curve is derived from the fitted peaks, which are identified with orange ticks. The light gray regions of the oscillation spectra indicate the ranges where radial and quadrupole modes hamper the detection of extra peaks.
Current usage metrics show cumulative count of Article Views (full-text article views including HTML views, PDF and ePub downloads, according to the available data) and Abstracts Views on Vision4Press platform.
Data correspond to usage on the plateform after 2015. The current usage metrics is available 48-96 hours after online publication and is updated daily on week days.
Initial download of the metrics may take a while.