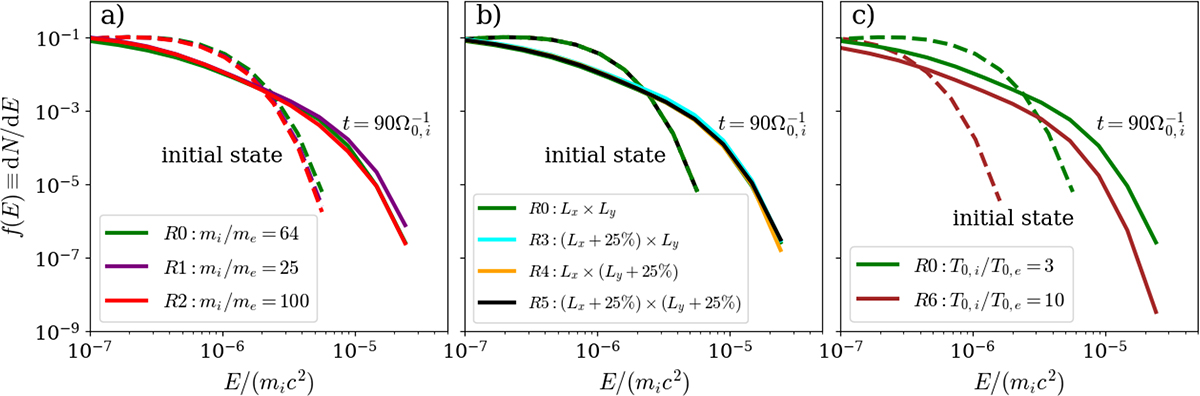
Fig. 1.
Download original image
Electron energy distributions for different simulations, considering the variation in specific parameters: the mass ratio, mi/me, in panel a; the simulation domain size, Lx × Ly, in panel b; and the initial temperature ratio, T0, i/T0, e, in panel c. The dashed lines show the initial energy distributions and the solid lines represent the distributions at ![]() .
.
Current usage metrics show cumulative count of Article Views (full-text article views including HTML views, PDF and ePub downloads, according to the available data) and Abstracts Views on Vision4Press platform.
Data correspond to usage on the plateform after 2015. The current usage metrics is available 48-96 hours after online publication and is updated daily on week days.
Initial download of the metrics may take a while.