Fig. 2.
Download original image
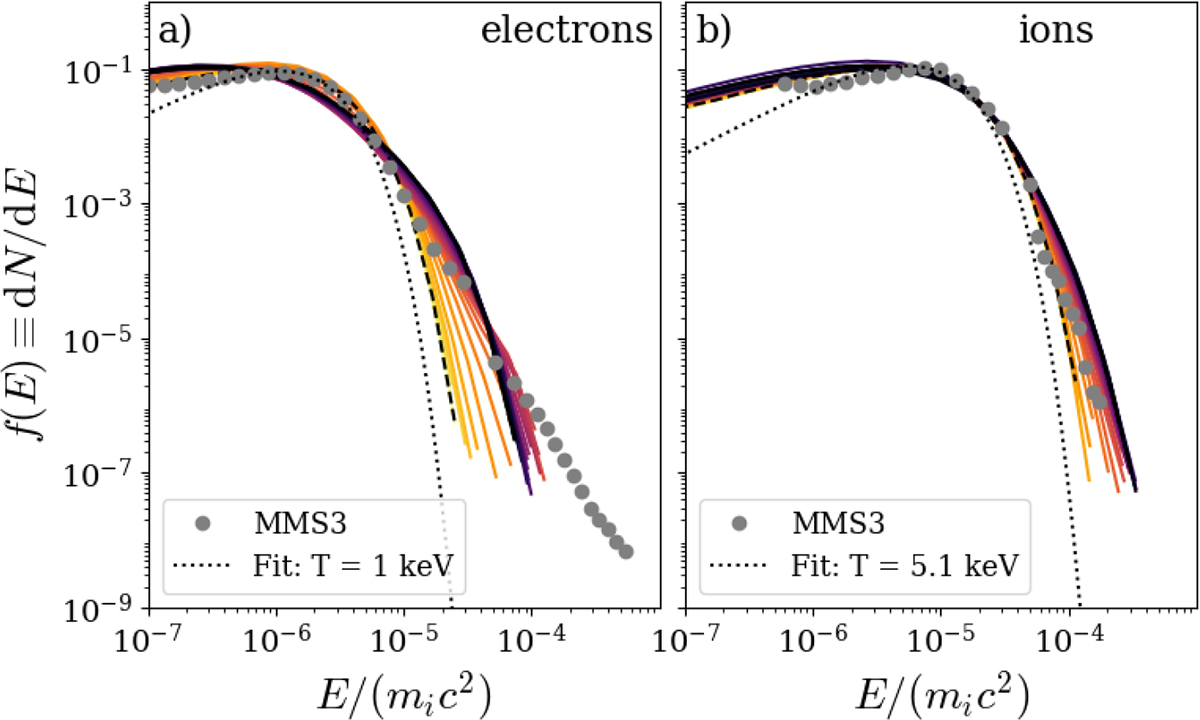
Energy distributions from MMS3 observations (gray dots) and simulation R7. Solid lines show the simulated electrons (a) and ions (b) at different times until ![]() , with later times in darker shades. Dotted lines represent Maxwellian fits of the core of the observed distributions, and dashed lines show the simulated energy distributions at initialization.
, with later times in darker shades. Dotted lines represent Maxwellian fits of the core of the observed distributions, and dashed lines show the simulated energy distributions at initialization.
Current usage metrics show cumulative count of Article Views (full-text article views including HTML views, PDF and ePub downloads, according to the available data) and Abstracts Views on Vision4Press platform.
Data correspond to usage on the plateform after 2015. The current usage metrics is available 48-96 hours after online publication and is updated daily on week days.
Initial download of the metrics may take a while.