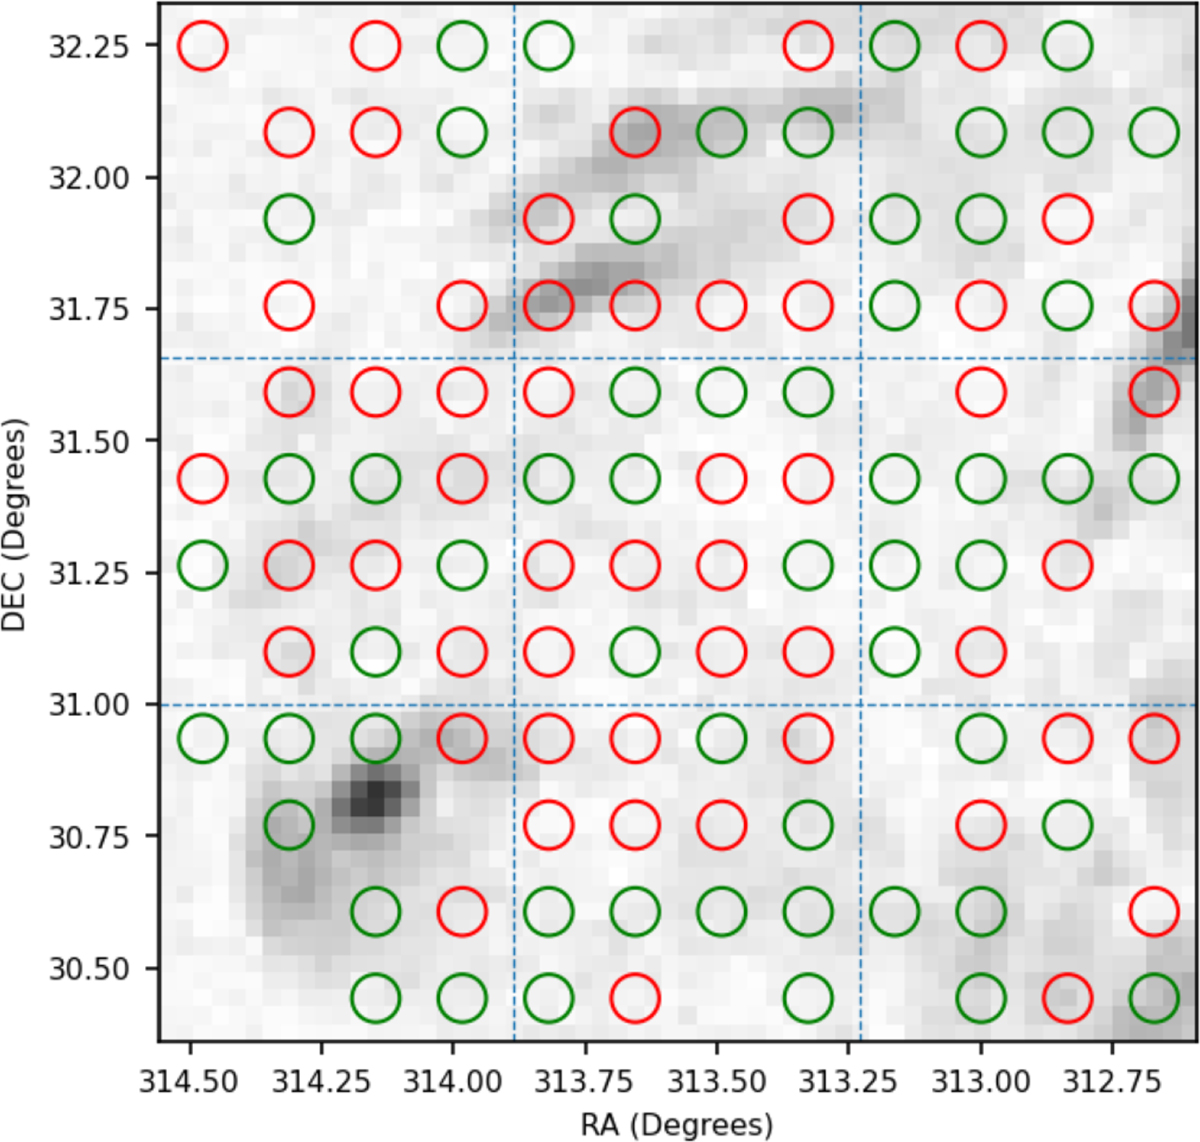
Fig. 15.
Download original image
Results from modified SPA+ method plotted on top of synchrotron-intensity map for the Cygnus Loop’s northern region. Each analysis spot corresponds to the classification obtained from a 2.5 pc × 2.5 pc sub-region. The rings show the identification of the dominant mode from the classification parameter, A4/A2. The red dots show the detection of fast modes through the asymmetry parameter, B4/A2. The green and red colours show the mode dominance of Alfvén and compressible modes, respectively. The regions where the SPA+ mode classification leads to mode ambiguity have been removed from the analysis.
Current usage metrics show cumulative count of Article Views (full-text article views including HTML views, PDF and ePub downloads, according to the available data) and Abstracts Views on Vision4Press platform.
Data correspond to usage on the plateform after 2015. The current usage metrics is available 48-96 hours after online publication and is updated daily on week days.
Initial download of the metrics may take a while.