Open Access
Fig. 8.
Download original image
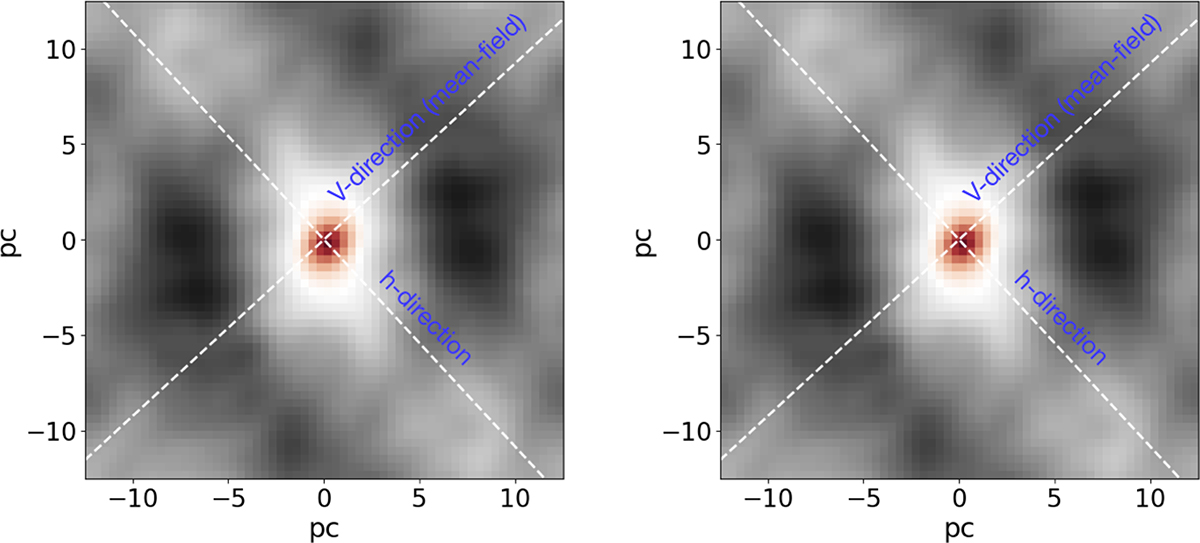
Distribution of correlation function for ![]() (left panel) and
(left panel) and ![]() (right panel) for the central region. We draw dashed white lines to depict the direction of the mean magnetic-field component in the plane of sky (B⊥), which is also the reference axis for estimating the anisotropy in both the v direction (B⊥) and the h direction.
(right panel) for the central region. We draw dashed white lines to depict the direction of the mean magnetic-field component in the plane of sky (B⊥), which is also the reference axis for estimating the anisotropy in both the v direction (B⊥) and the h direction.
Current usage metrics show cumulative count of Article Views (full-text article views including HTML views, PDF and ePub downloads, according to the available data) and Abstracts Views on Vision4Press platform.
Data correspond to usage on the plateform after 2015. The current usage metrics is available 48-96 hours after online publication and is updated daily on week days.
Initial download of the metrics may take a while.