Fig. 1
Download original image
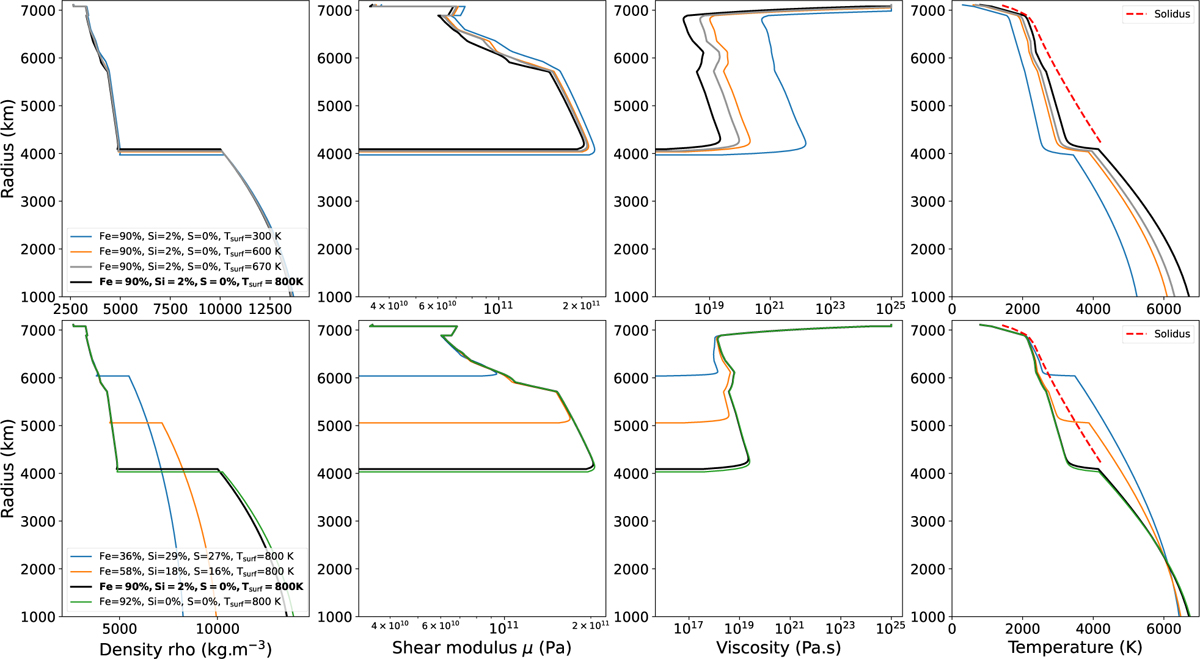
Density, shear modulus, viscosity, and temperature profiles of TRAPPIST-1b computed with BurnMan code for different compositions (listed in Table 1). Top: influence of temperature on profile. Bottom: influence of composition on profile. The black curve shows the same composition in all panels (Earth-like composition and a surface temperature of 800 K). The gray curve in the top panels shows the curve corresponding to the reference temperature (here 670 K). The rightmost panels also show the temperature of the solidus (red dashed line).
Current usage metrics show cumulative count of Article Views (full-text article views including HTML views, PDF and ePub downloads, according to the available data) and Abstracts Views on Vision4Press platform.
Data correspond to usage on the plateform after 2015. The current usage metrics is available 48-96 hours after online publication and is updated daily on week days.
Initial download of the metrics may take a while.