Fig. 2
Download original image
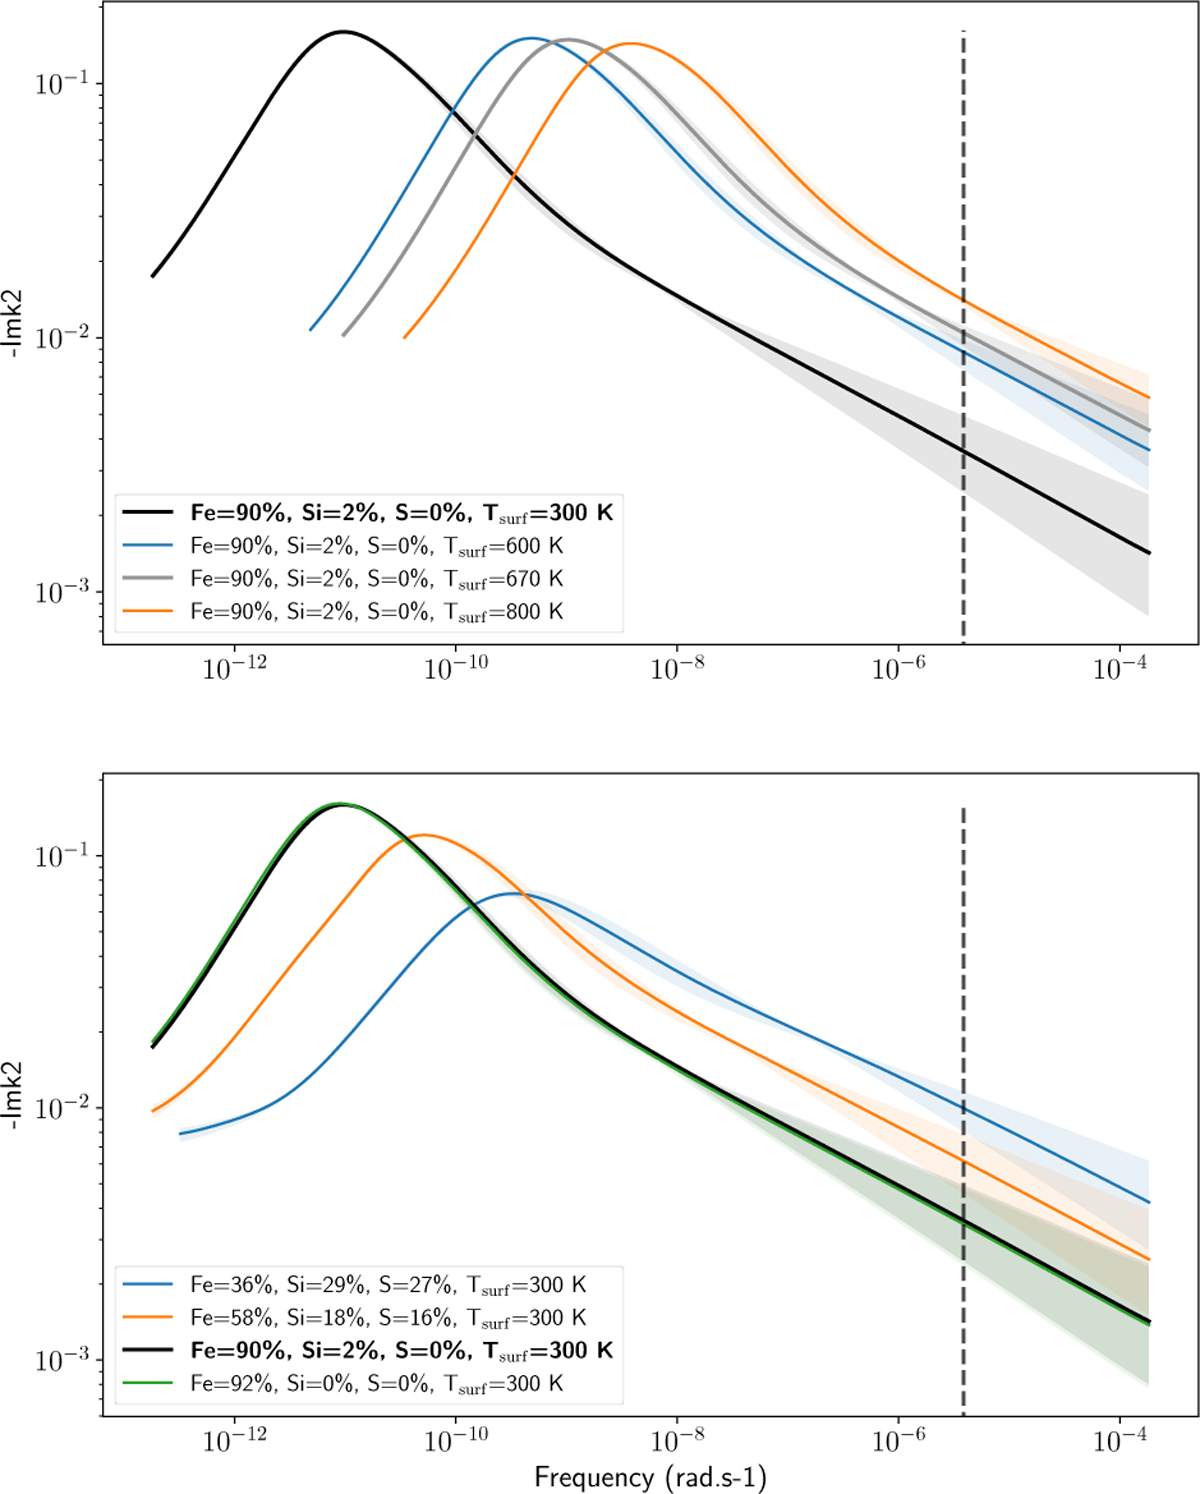
Frequency dependence of imaginary part of Love number for T-1b, for different compositions and temperatures (listed in Table 1). Top: influence of temperature. Bottom: influence of composition. The black curve shows the same composition in both panels (Earth-like composition and a surface temperature of 300 K). The gray curve in the top panel shows the curve corresponding to the reference temperature (here 670 K). The excitation frequency of T-1b is shown as the vertical black dashed line, which corresponds to its orbital frequency. The shaded region illustrates the dependence of the imaginary part on α (bracketed between 0.20 and 0.30). At the frequency of the planet, the dissipation for α=0.20 is higher than for α=0.30.
Current usage metrics show cumulative count of Article Views (full-text article views including HTML views, PDF and ePub downloads, according to the available data) and Abstracts Views on Vision4Press platform.
Data correspond to usage on the plateform after 2015. The current usage metrics is available 48-96 hours after online publication and is updated daily on week days.
Initial download of the metrics may take a while.