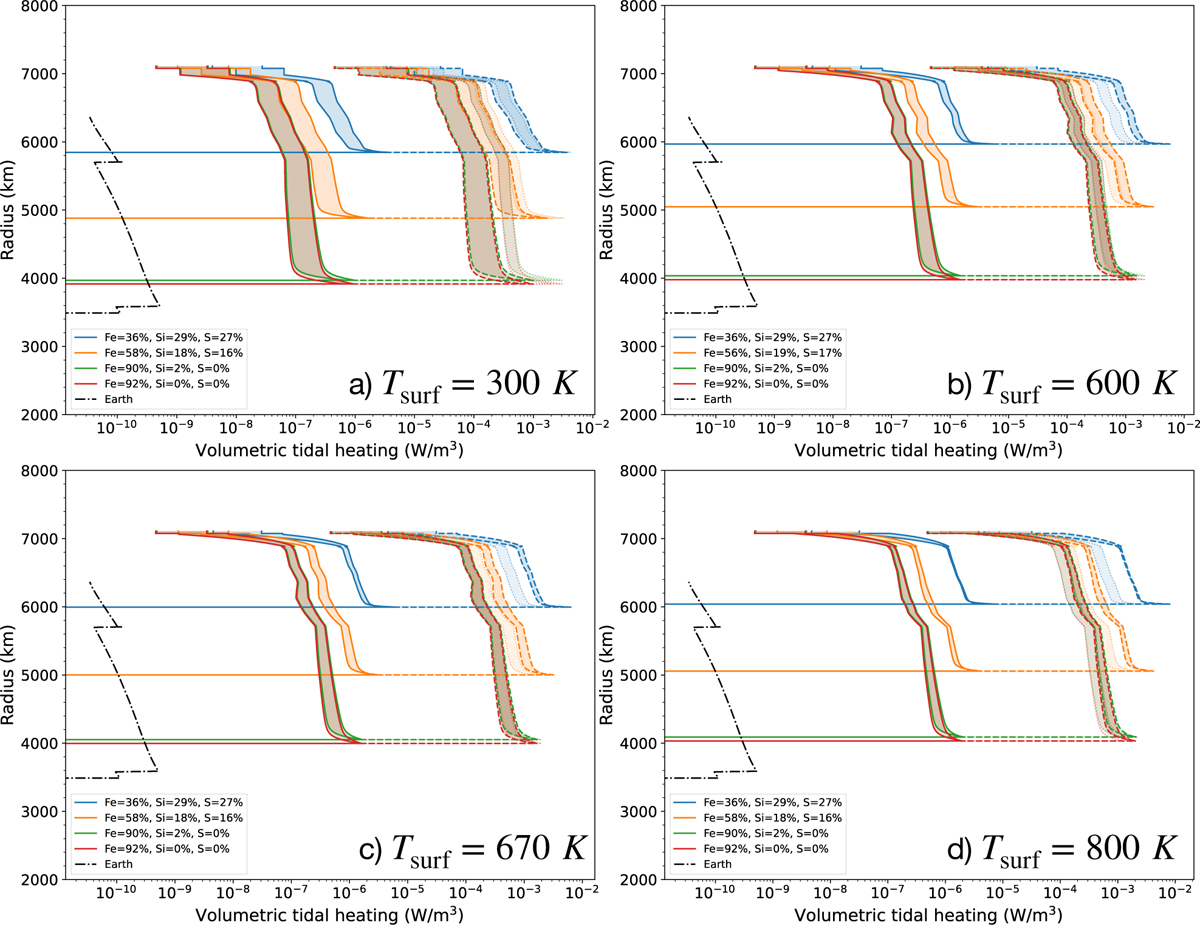
Fig. 3
Download original image
Volumetric tidal heating profile for T1-b for different surface temperatures (and thus viscosity profiles): (a) 300 K, (b) 600 K, (c) 670 K, (d) 800 K. The different colors represent the different structures listed in Table 1. The areas delimited by the full (dashed) lines correspond to the minimum (maximum) eccentricities given in Table 2. The extent of the areas represents the sensitivity of the profile to α, with the lower (left) limit corresponding to α=0.30 and the upper (right) limit corresponding to α=0.20. These profiles were obtained with Eq. (2). The tidal heating profile of the Earth is shown in a dashed black line as in Bolmont et al. (2020a). Additionally, we represent areas delimited by faint dotted lines. These profiles are compatible with JWST observational constraints on the nightside temperature of the T1-b (291 K at 2σ, 322 K at 3σ from Gillon et al. 2025), which are here hypothesized to be equal to a tidal temperature. The lower left limit thus corresponds to 291 K, and the upper right to 322 K.
Current usage metrics show cumulative count of Article Views (full-text article views including HTML views, PDF and ePub downloads, according to the available data) and Abstracts Views on Vision4Press platform.
Data correspond to usage on the plateform after 2015. The current usage metrics is available 48-96 hours after online publication and is updated daily on week days.
Initial download of the metrics may take a while.