Fig. 4
Download original image
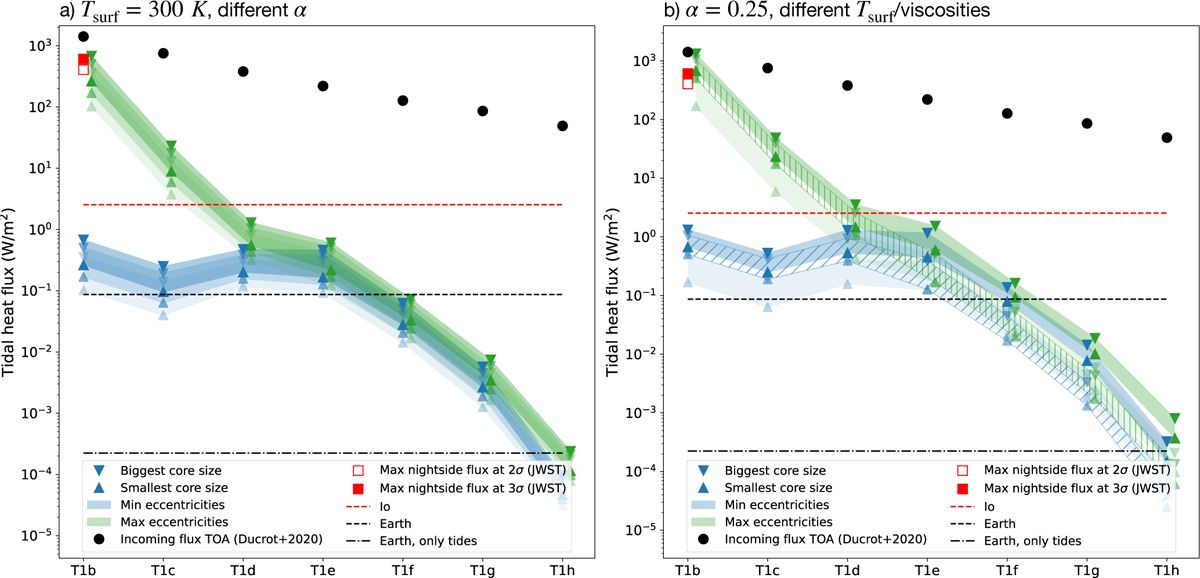
Total heat flux for all planets. Left: calculated for a surface temperature of 300 K (or a high viscosity). The transparency of the colored areas represents the dependency on α, with the more transparent (lower values of tidal heating) corresponding to α=0.30. Right: calculated for an α=0.25. The lighter shaded region (lower values of tidal heating) corresponds to a surface temperature of 300 K (high viscosities). The darker shaded region (higher values of tidal heating) corresponds to a surface temperature of 800 K (low viscosities). The hatched region corresponds to the reference temperatures (670 K for b and c, 650 K for d, 300 K for e, 250 K for f, 210 K for g, and 170 K for h). The colored area delimited by triangles represents the uncertainty we have on the internal structure, for a given assumption of the eccentricity (blue: minimum eccentricity, green: maximum eccentricity). These values are compared to the tidal heat flux of Io (full red triangle), Earth’s heat flux (full black triangle), and the Earth’s tidal heat flux (black triangle). The top of atmosphere (TOA) fluxes coming from Ducrot et al. (2020) are shown as full black circles. Finally, we show as red squares recent observational constraints from the JWST (Gillon et al. 2025) for the maximum nightside temperature of T1-b, which we assume is a tidal temperature (see Sect. 3.2).
Current usage metrics show cumulative count of Article Views (full-text article views including HTML views, PDF and ePub downloads, according to the available data) and Abstracts Views on Vision4Press platform.
Data correspond to usage on the plateform after 2015. The current usage metrics is available 48-96 hours after online publication and is updated daily on week days.
Initial download of the metrics may take a while.