Fig. 5.
Download original image
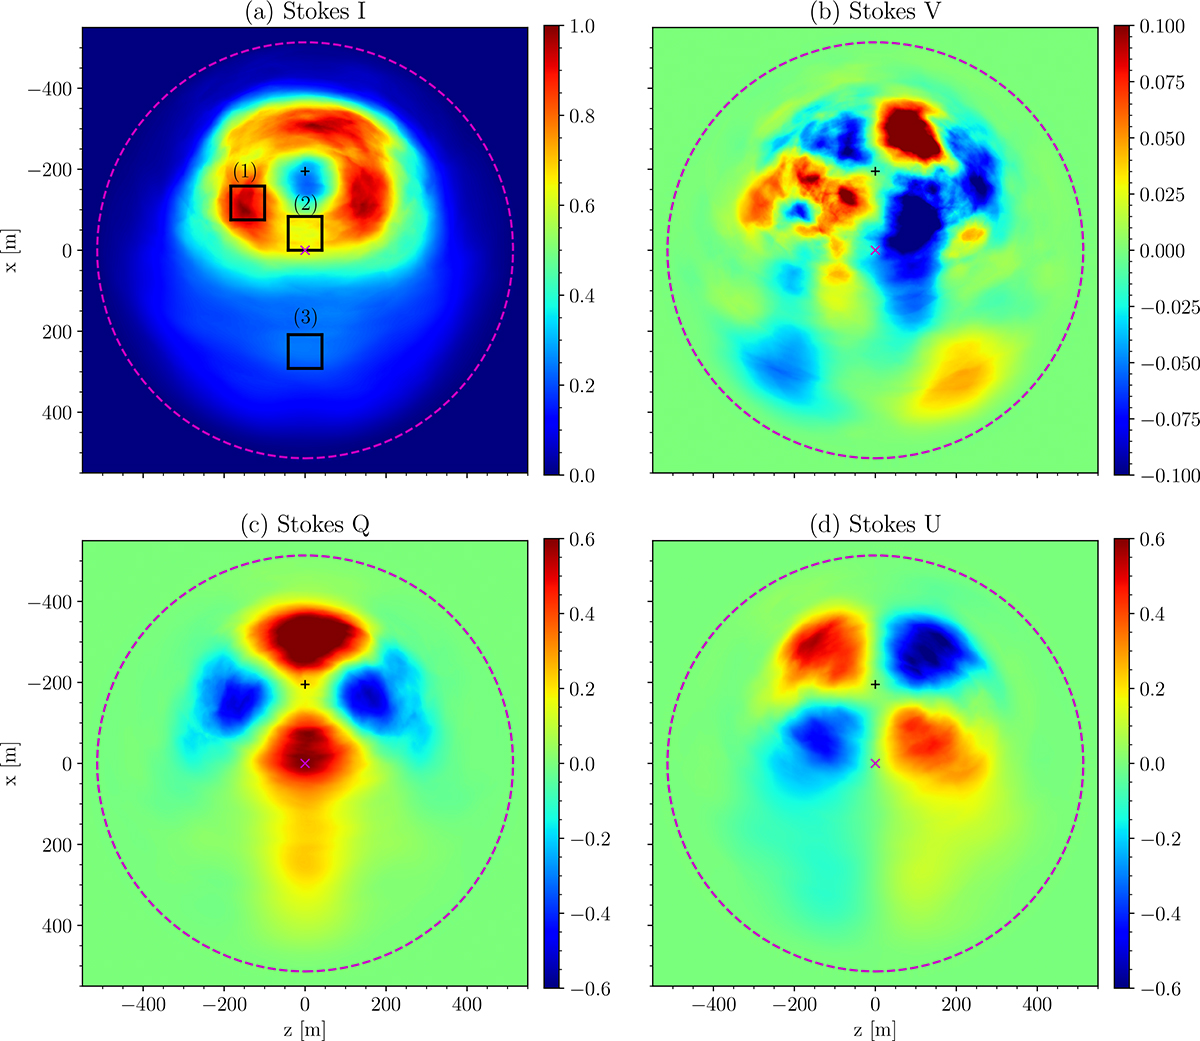
Stokes parameters I, V, Q, and U (a–d) of the escaping radiation captured in a plane at a height H ≈ 2150 m, averaged over the time interval T ∈ [34.7, 43.4] μs, and normalized to the maximum value of the Stokes I value. The dashed magenta line denotes the last open field line, and the magenta plus shows the dipole axis. The black plus denotes the maximum of the average plasma density. The black squares in (a) denote regions for which the spectra are analyzed below. The color scales differ between figures.
Current usage metrics show cumulative count of Article Views (full-text article views including HTML views, PDF and ePub downloads, according to the available data) and Abstracts Views on Vision4Press platform.
Data correspond to usage on the plateform after 2015. The current usage metrics is available 48-96 hours after online publication and is updated daily on week days.
Initial download of the metrics may take a while.