Fig. 6.
Download original image
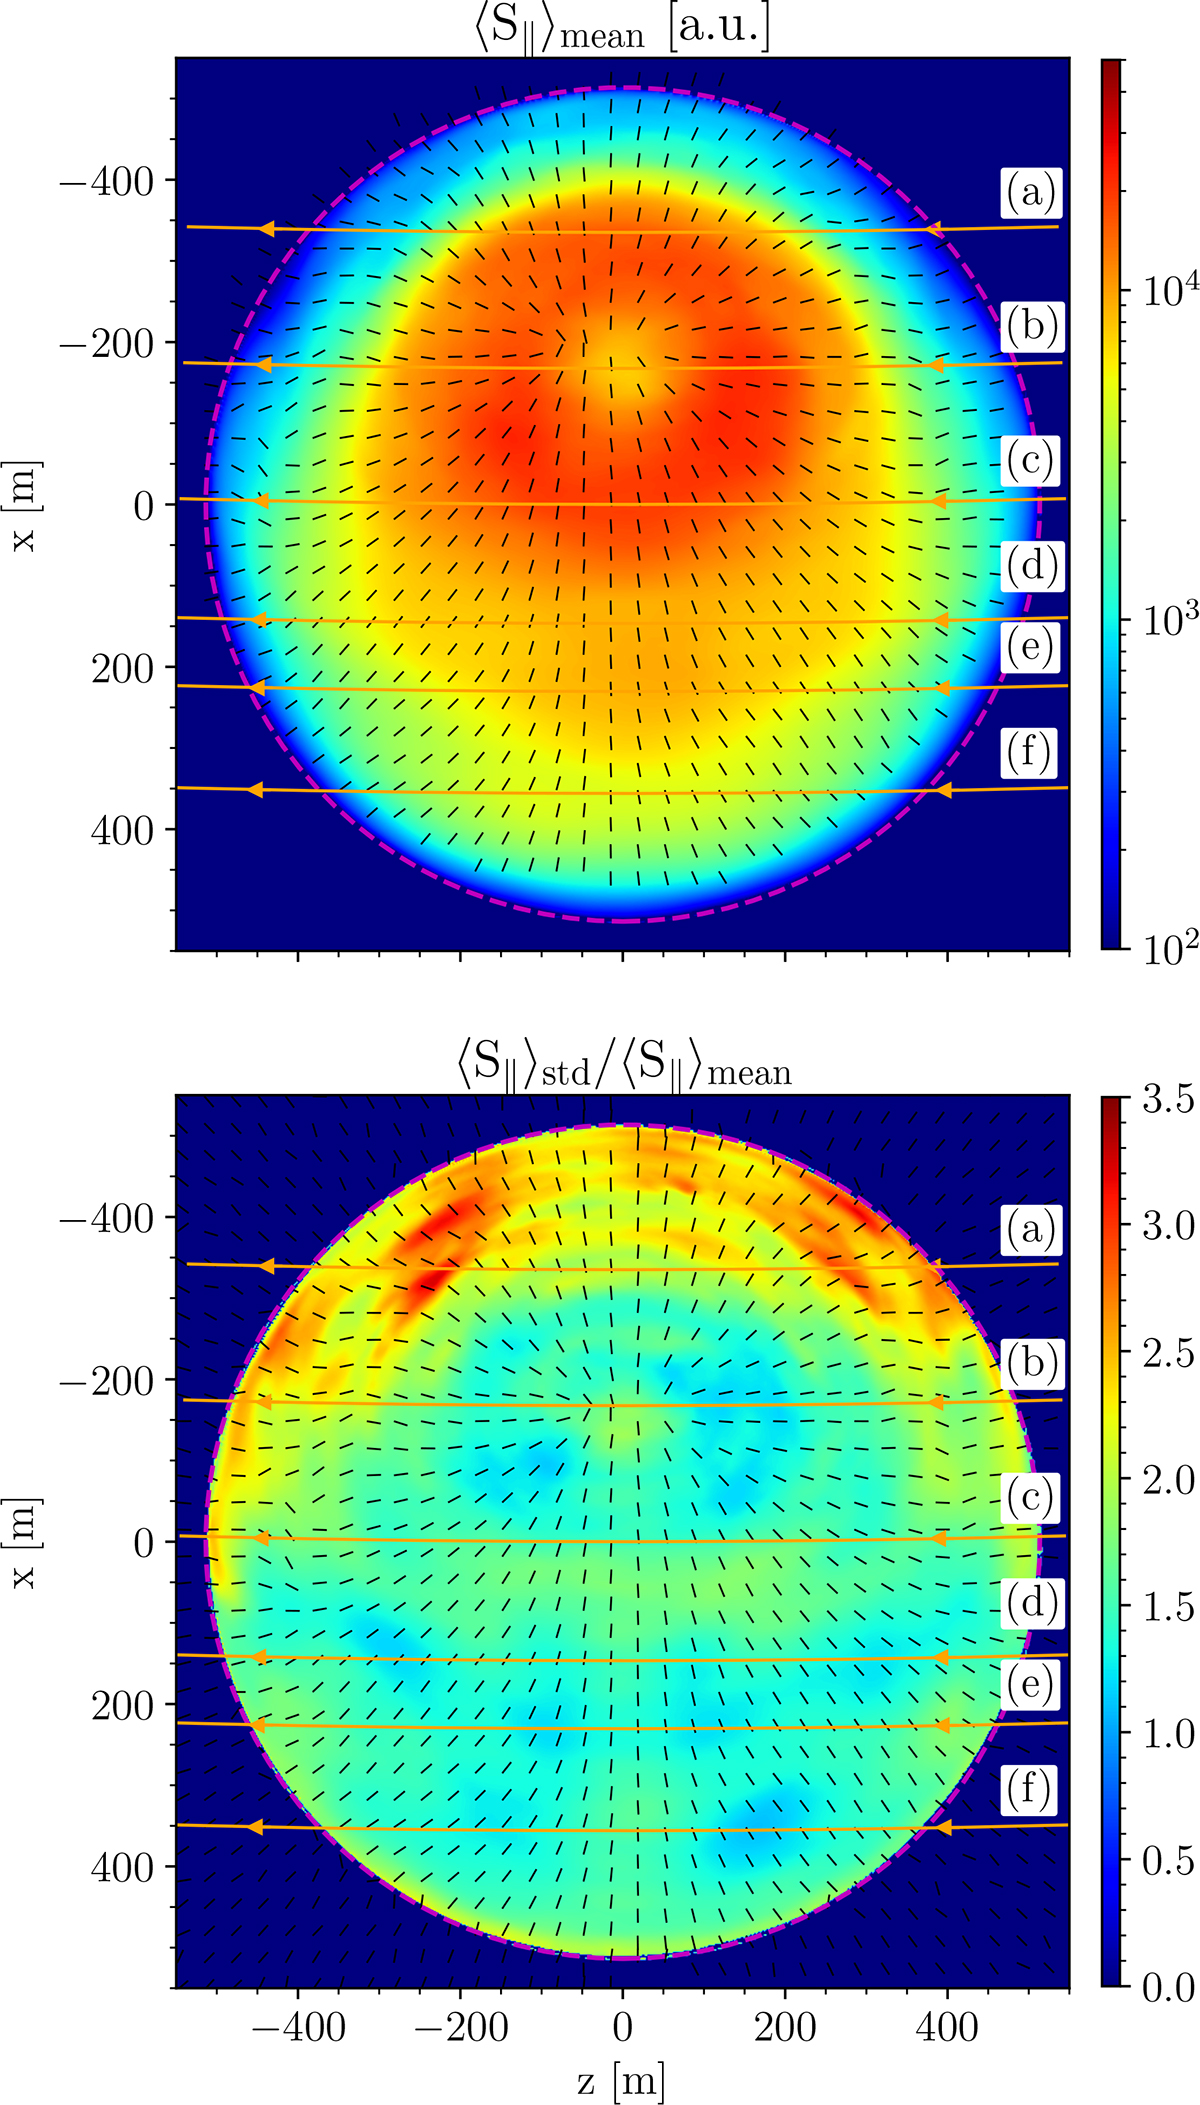
Parallel component of the escaping Poynting flux as captured in the detection plane at a height H ≈ 2150 m and averaged over the time interval T ∈ [34.7, 43.4] μs. Top panel: Averaged Poynting flux. Bottom panel: Normalized standard deviation of the Poynting flux, overlaid with black lines indicating the PA. The dashed magenta line denotes the last open field line. The orange lines denote the trajectories of constant latitudes used for further investigation.
Current usage metrics show cumulative count of Article Views (full-text article views including HTML views, PDF and ePub downloads, according to the available data) and Abstracts Views on Vision4Press platform.
Data correspond to usage on the plateform after 2015. The current usage metrics is available 48-96 hours after online publication and is updated daily on week days.
Initial download of the metrics may take a while.