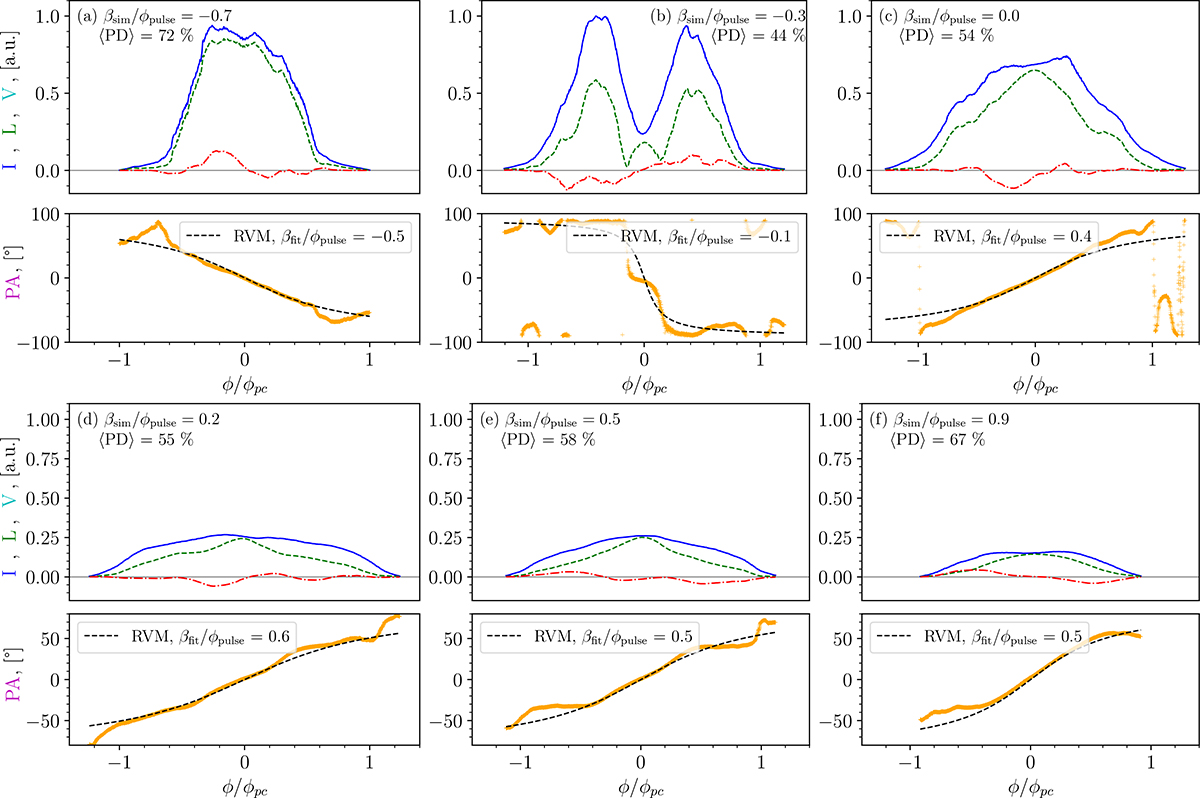
Fig. 7.
Download original image
Stokes parameters of the electromagnetic fluxes and their polarization properties as captured in a plane at a height H and averaged over a time interval δt. The trajectory approaches the dipole axis at a minimum angular distance βsim. Blue line: Stokes parameter I of the total flux. Dashed green line: Stokes parameter |L| of the linearly polarized flux. Dash-dotted red line: Stokes parameter V of the circularly polarized flux. Orange crosses: PA. Dashed black line: The RVM fit (Eq. (24)) of the PA. The positions of the profiles (a–f) are shown in Fig. 6 as orange lines. The PA scales between plots.
Current usage metrics show cumulative count of Article Views (full-text article views including HTML views, PDF and ePub downloads, according to the available data) and Abstracts Views on Vision4Press platform.
Data correspond to usage on the plateform after 2015. The current usage metrics is available 48-96 hours after online publication and is updated daily on week days.
Initial download of the metrics may take a while.