Fig. 8.
Download original image
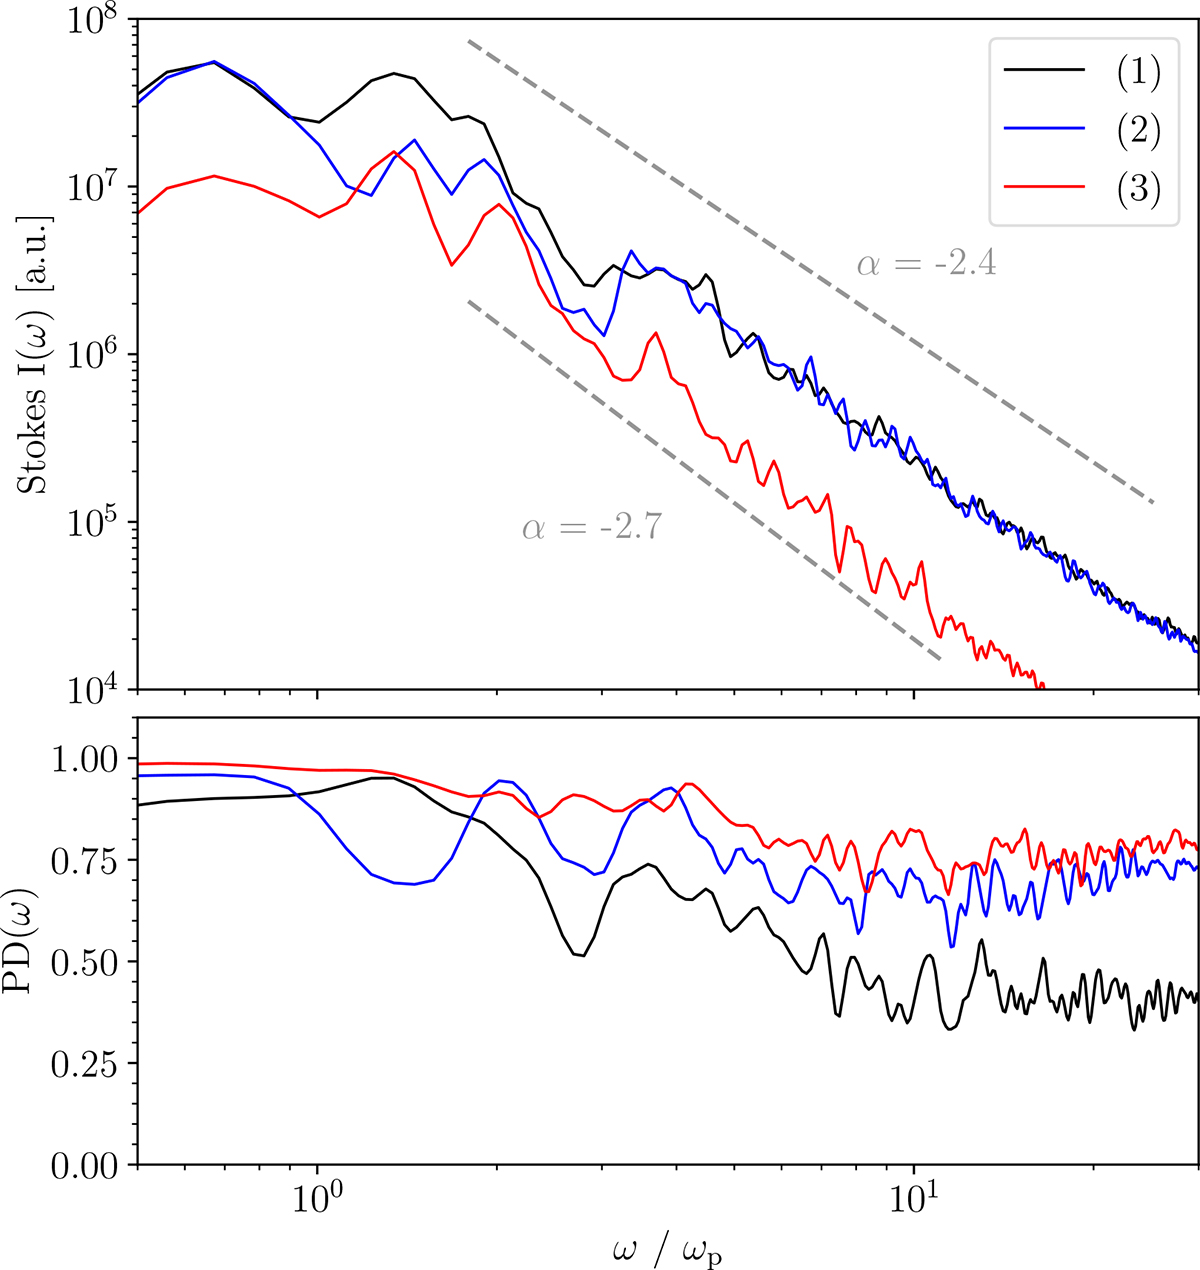
Top panel: Power spectra of Stokes I parameters (right) for three positions in the polar cap (left) with the frequency scaled to the plasma frequency ωp = 1.6 ⋅ 109 rad s−1. The analyzed regions are denoted as black boxes in Fig. 5a. Bottom panel: Polarization degree as a function of frequency at the same locations as above.
Current usage metrics show cumulative count of Article Views (full-text article views including HTML views, PDF and ePub downloads, according to the available data) and Abstracts Views on Vision4Press platform.
Data correspond to usage on the plateform after 2015. The current usage metrics is available 48-96 hours after online publication and is updated daily on week days.
Initial download of the metrics may take a while.