Fig. 2
Download original image
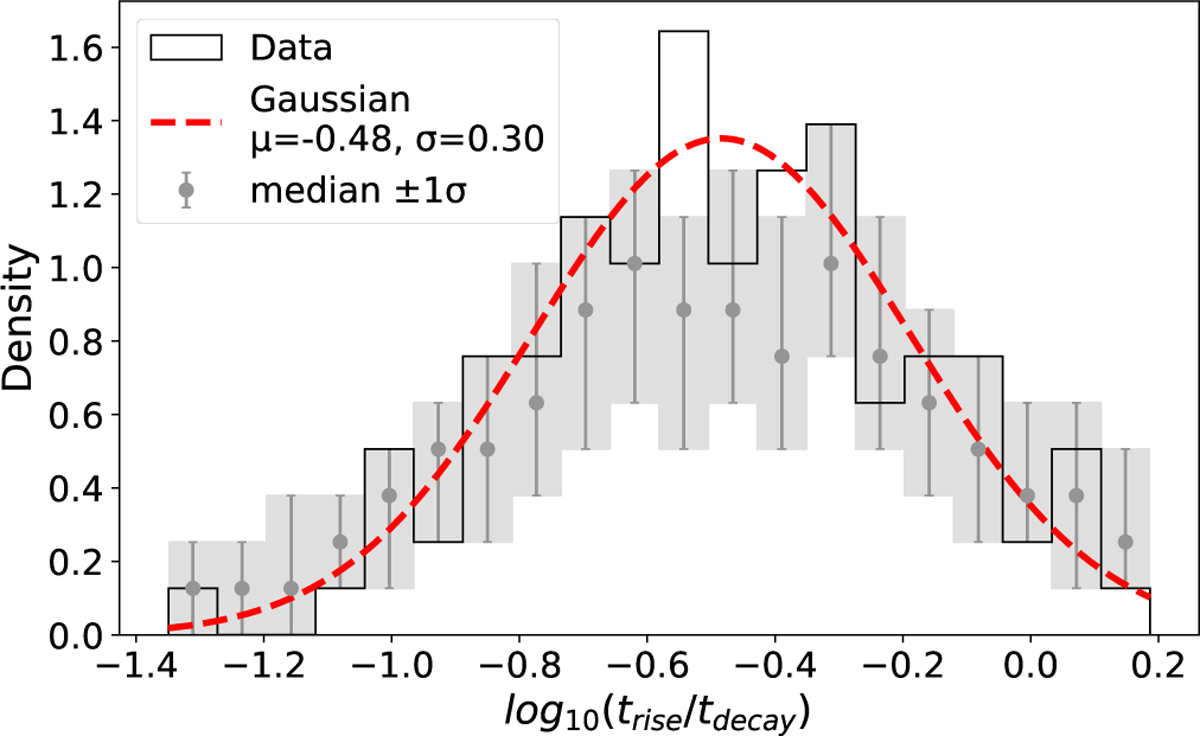
Distribution of the trise/tdecay ratio for 103 TDE flares in our catalogue (black step histogram). The dashed red line indicates a Gaussian distribution with μ = −0.48 and σ = 0.30 overplotted on the data. The grey data points and boxes represent the median of the mock distributions for each bin and corresponding uncertainty respectively.
Current usage metrics show cumulative count of Article Views (full-text article views including HTML views, PDF and ePub downloads, according to the available data) and Abstracts Views on Vision4Press platform.
Data correspond to usage on the plateform after 2015. The current usage metrics is available 48-96 hours after online publication and is updated daily on week days.
Initial download of the metrics may take a while.