Fig. 6
Download original image
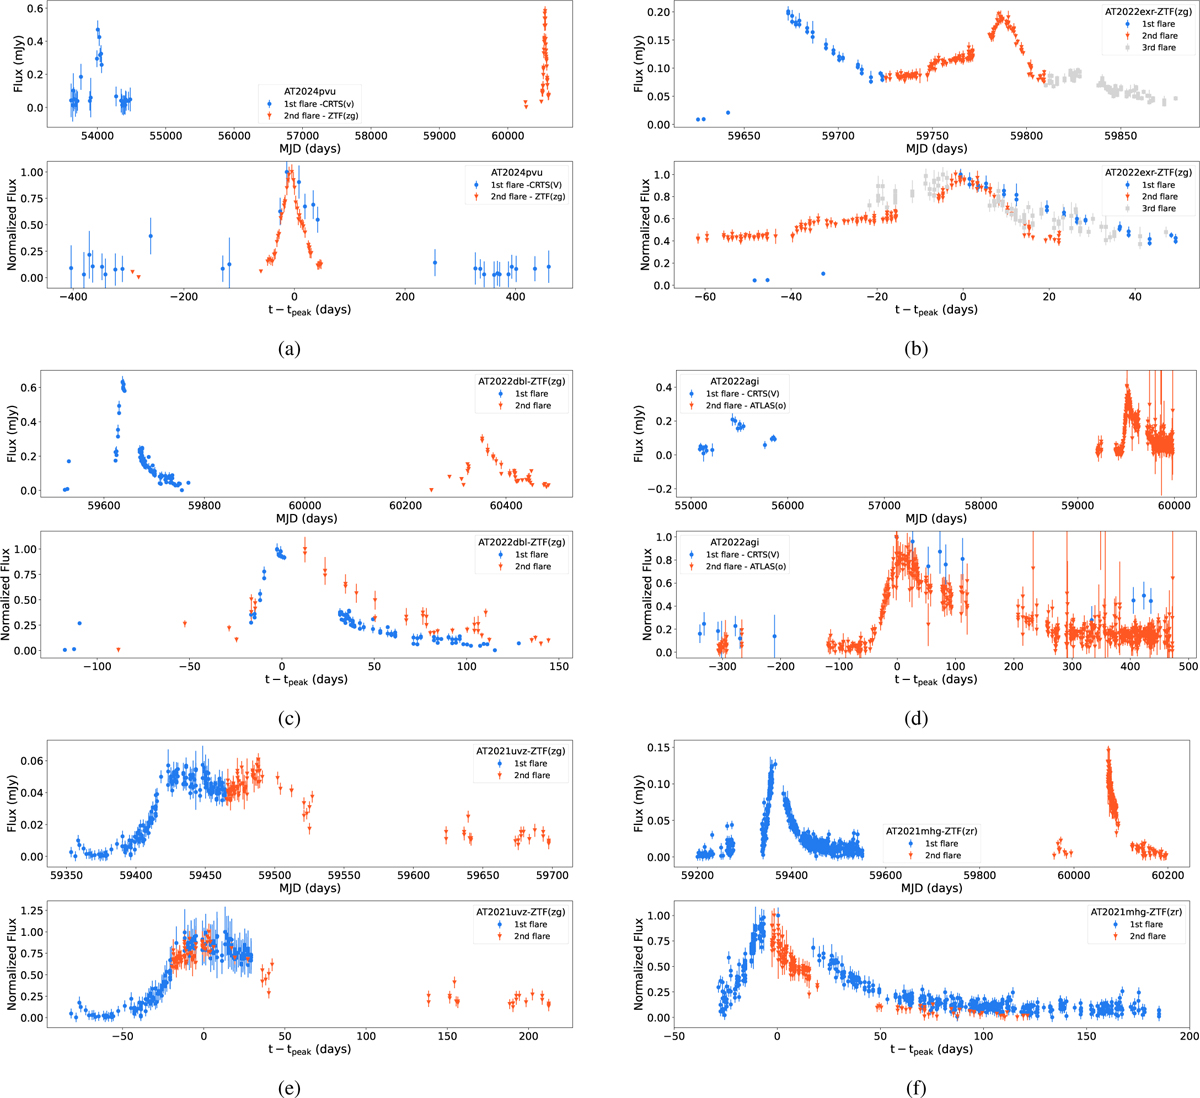
Optical light curves of the repeating flare TDEs shown in the different panel pairs (a–1). The initial flares are plotted using filled blue circles, with the following flares plotted using filled orange triangles and filled grey squares. In all panel pairs the upper panel shows the optical light curves of the flare regions from different surveys, while the bottom panel displays the two flares, shifted with respect to the flare peak in time and flux.
Continued.
Current usage metrics show cumulative count of Article Views (full-text article views including HTML views, PDF and ePub downloads, according to the available data) and Abstracts Views on Vision4Press platform.
Data correspond to usage on the plateform after 2015. The current usage metrics is available 48-96 hours after online publication and is updated daily on week days.
Initial download of the metrics may take a while.