Fig. 7
Download original image
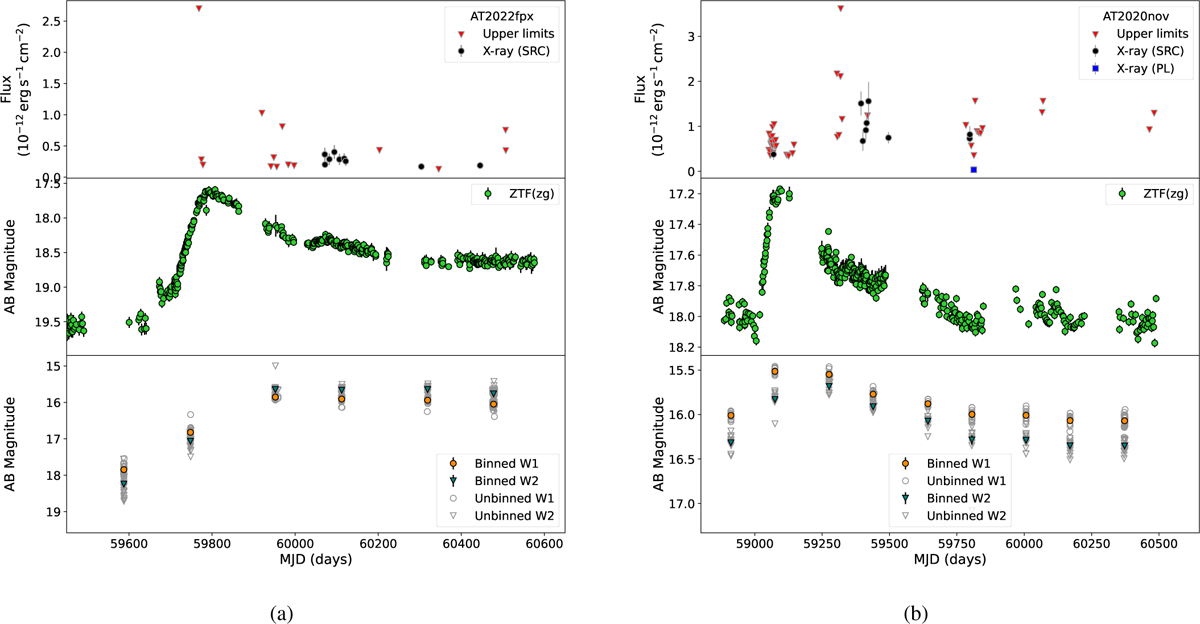
X-ray, optical, and IR light curves of AT 2022fpx and AT 2020nov in the upper, middle, and bottom panels respectively. For the IR light curves, we show both W1 and W2 binned NEOWISE light curves using orange filled circles and upside-down filled blue triangles respectively, while their un-binned data points are plotted with grey shapes.
Current usage metrics show cumulative count of Article Views (full-text article views including HTML views, PDF and ePub downloads, according to the available data) and Abstracts Views on Vision4Press platform.
Data correspond to usage on the plateform after 2015. The current usage metrics is available 48-96 hours after online publication and is updated daily on week days.
Initial download of the metrics may take a while.