Open Access
Fig. C.1
Download original image
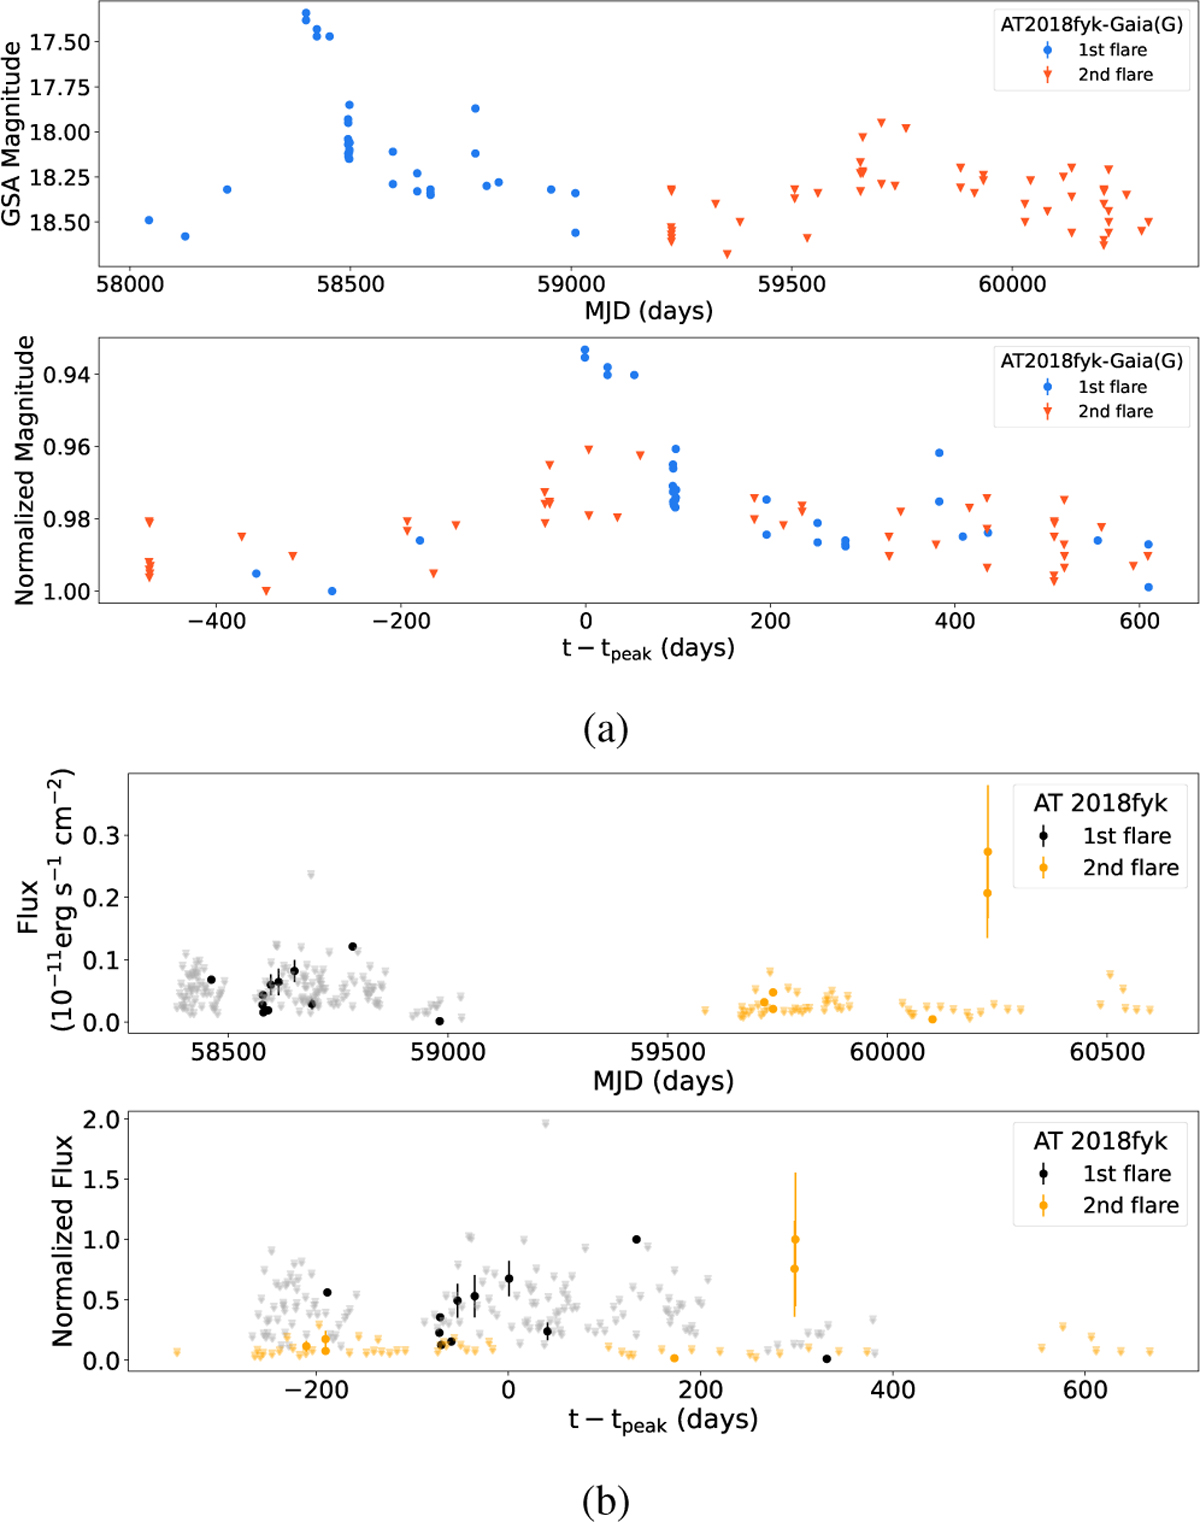
Archival optical and X-ray light curves of AT 2018fyk. (a) : Same as for Fig. 6 but for the Gaia G-band light curve of AT 2018fyk. (b) : Same as Fig. 6 but for the catalogue X-ray data of AT 2018fyk. The black points and orange points show the detections, while the grey and light orange points show the 3σ upper limits.
Current usage metrics show cumulative count of Article Views (full-text article views including HTML views, PDF and ePub downloads, according to the available data) and Abstracts Views on Vision4Press platform.
Data correspond to usage on the plateform after 2015. The current usage metrics is available 48-96 hours after online publication and is updated daily on week days.
Initial download of the metrics may take a while.