Open Access
Fig. C.3
Download original image
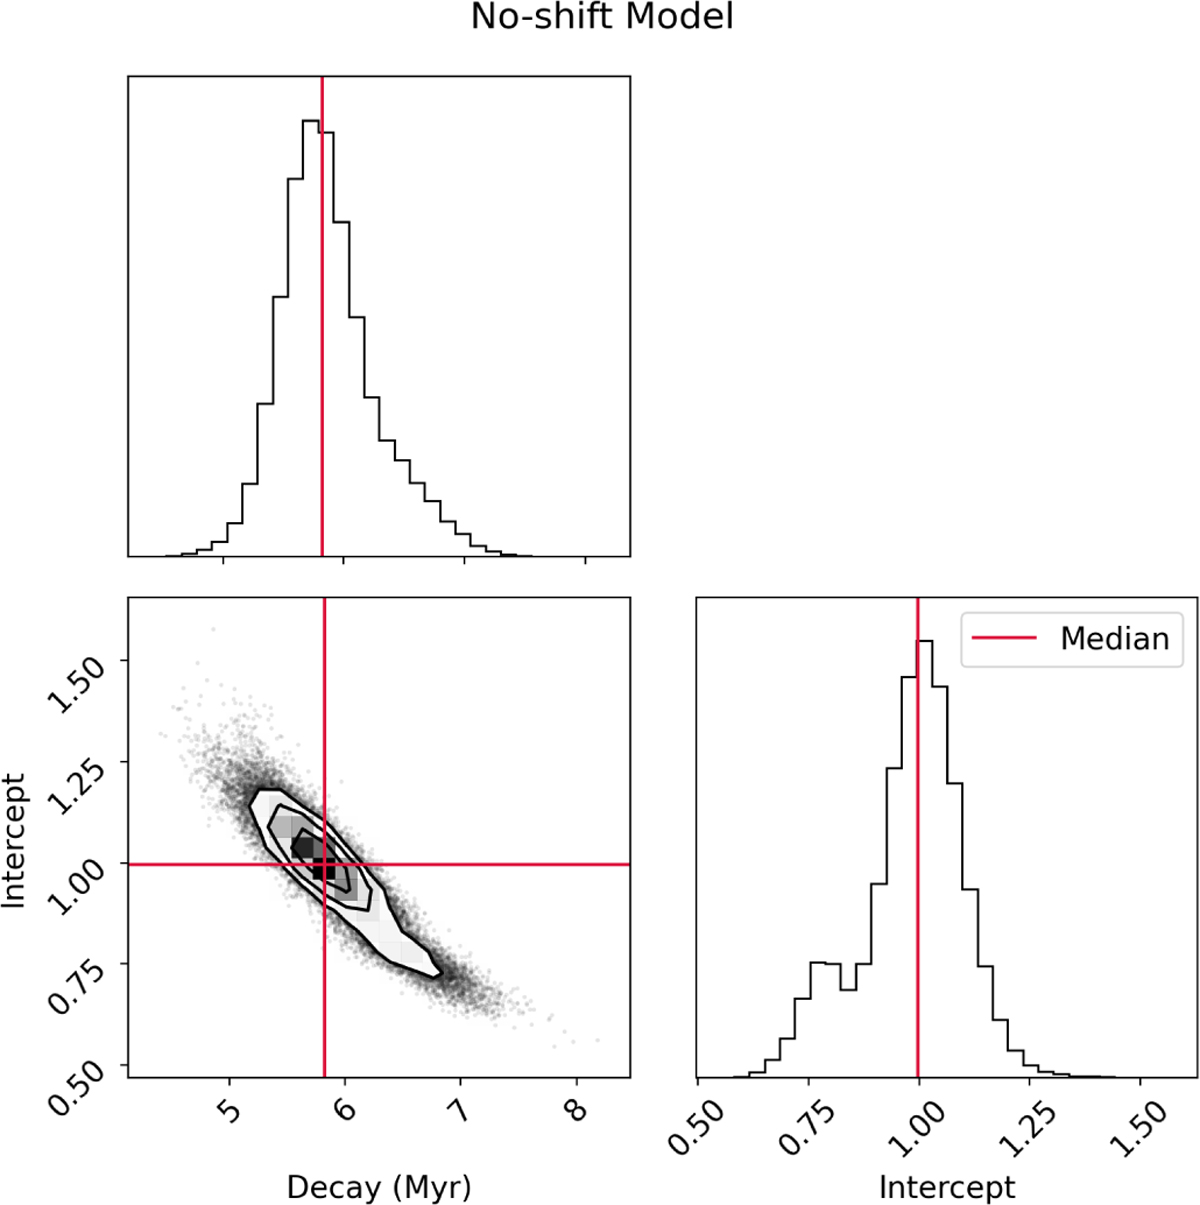
Corner plot of the sampled parameters as determined with the no-shift model (see Appendix B). The structure and color are the same as in Fig. C.1 while the shift parameter t0 is excluded here, since it is a constant in the no-shift model.
Current usage metrics show cumulative count of Article Views (full-text article views including HTML views, PDF and ePub downloads, according to the available data) and Abstracts Views on Vision4Press platform.
Data correspond to usage on the plateform after 2015. The current usage metrics is available 48-96 hours after online publication and is updated daily on week days.
Initial download of the metrics may take a while.