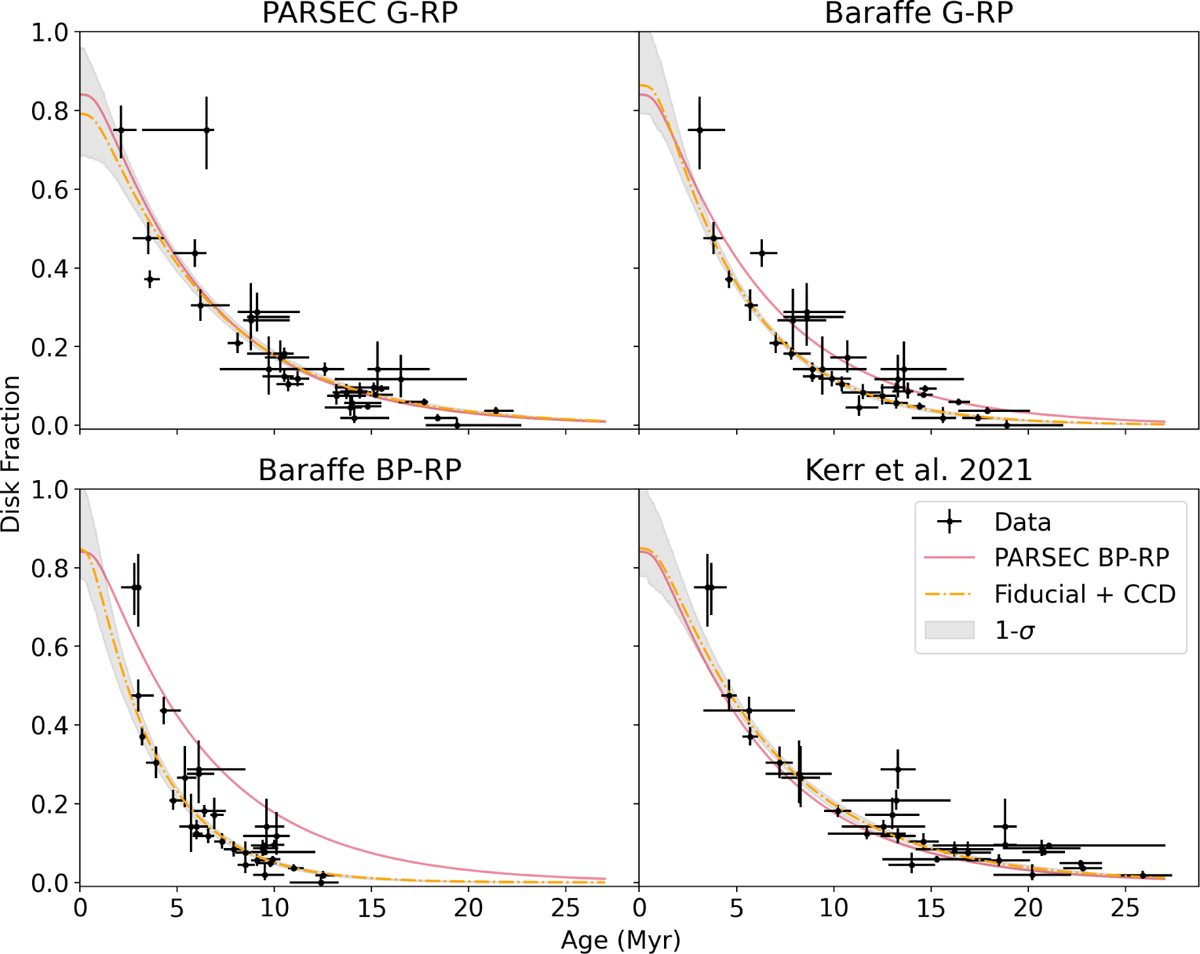
Fig. C.4
Download original image
Disk fraction versus age for different samples of ages. The black data points again represent the stellar clusters, where the disk fraction is constant among all plots (CCD selection). The top left plot shows ages from PARSEC-G-RP, the top right Baraffe-G-RP, the bottom left Baraffe-BP-RP and the bottom right the ages from Kerr et al. (2021). The orange, dashed line denotes the median of the fiducial+CCD result applied on these ages and the gray area is the 1σ confidence interval. The red solid line gives the fiducial+CCD result from Fig. 2 using the PARSEC-BP-RP ages. The uncertainties in ages are from Ratzenböck et al. (2023b) or Kerr et al. (2021) and the disk fraction uncertainties are the same as in Fig. 2.
Current usage metrics show cumulative count of Article Views (full-text article views including HTML views, PDF and ePub downloads, according to the available data) and Abstracts Views on Vision4Press platform.
Data correspond to usage on the plateform after 2015. The current usage metrics is available 48-96 hours after online publication and is updated daily on week days.
Initial download of the metrics may take a while.