Fig. 2
Download original image
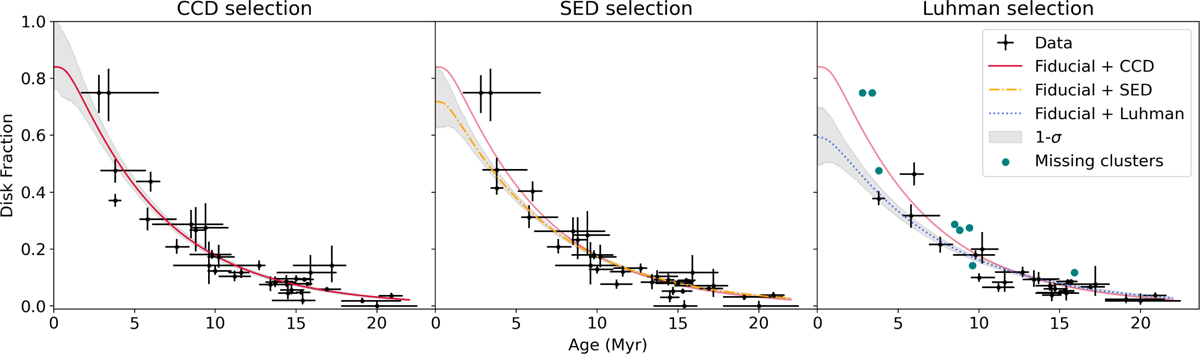
Disk fraction versus age. The black data points represent the stellar clusters, on the left for the CCD selection, in the middle for the SED selection and on the right for the Luhman selection. The Luhman selection only includes 25 out of 33 stellar clusters because the study by Luhman (2022) encompasses a smaller region compared to Ratzenböck et al. (2023a). Shown in green-blue in the right plot are the missing stellar clusters (from the CCD selection). In the left plot, the red line represents the median of the fiducial+CCD result, which is also shown in the middle and right plot with reduced transparency. The orange dash-dotted line in the middle plot gives the median of the fiducial+SED result. The blue dotted line is the median of the fiducial+Luhman result. The gray area shows the 1σ confidence interval for each median result. The uncertainties in ages are from Ratzenböck et al. (2023b) and the disk fraction uncertainties are derived from the underlying counting process which can be modeled as a simple Bernoulli trial.
Current usage metrics show cumulative count of Article Views (full-text article views including HTML views, PDF and ePub downloads, according to the available data) and Abstracts Views on Vision4Press platform.
Data correspond to usage on the plateform after 2015. The current usage metrics is available 48-96 hours after online publication and is updated daily on week days.
Initial download of the metrics may take a while.