Fig. 3
Download original image
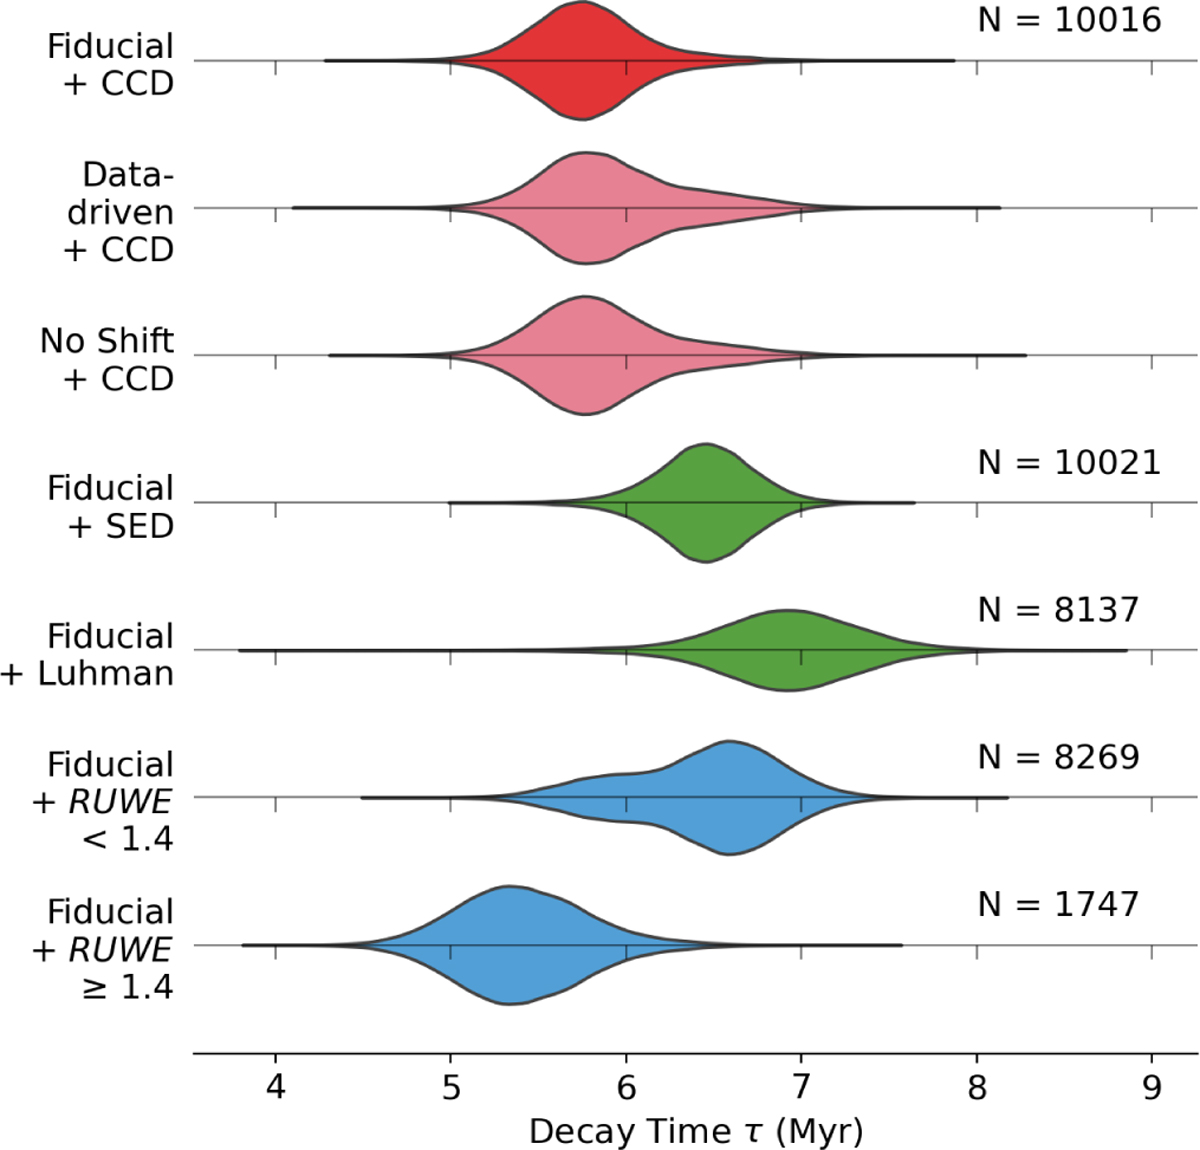
Violin plot showing the posterior probability density functions (PDFs) of the disk decay time parameter τ. The x-axis denotes the decay time in Myr, while the y-axis labels each model and disk selection method. The number N displayed next to each distribution indicates the number of sources used in the corresponding fit; this number remains constant for the top three rows, where only the model configuration varies. Posterior distributions are grouped and color-coded: red indicates variations in prior assumptions (with the fiducial model highlighted at the top), green represents the supplementary disk selection methods (SED, Luhman) and blue corresponds to subsamples based on stellar multiplicity (single vs. candidate binaries). See Table 1 for the corresponding numerical results.
Current usage metrics show cumulative count of Article Views (full-text article views including HTML views, PDF and ePub downloads, according to the available data) and Abstracts Views on Vision4Press platform.
Data correspond to usage on the plateform after 2015. The current usage metrics is available 48-96 hours after online publication and is updated daily on week days.
Initial download of the metrics may take a while.