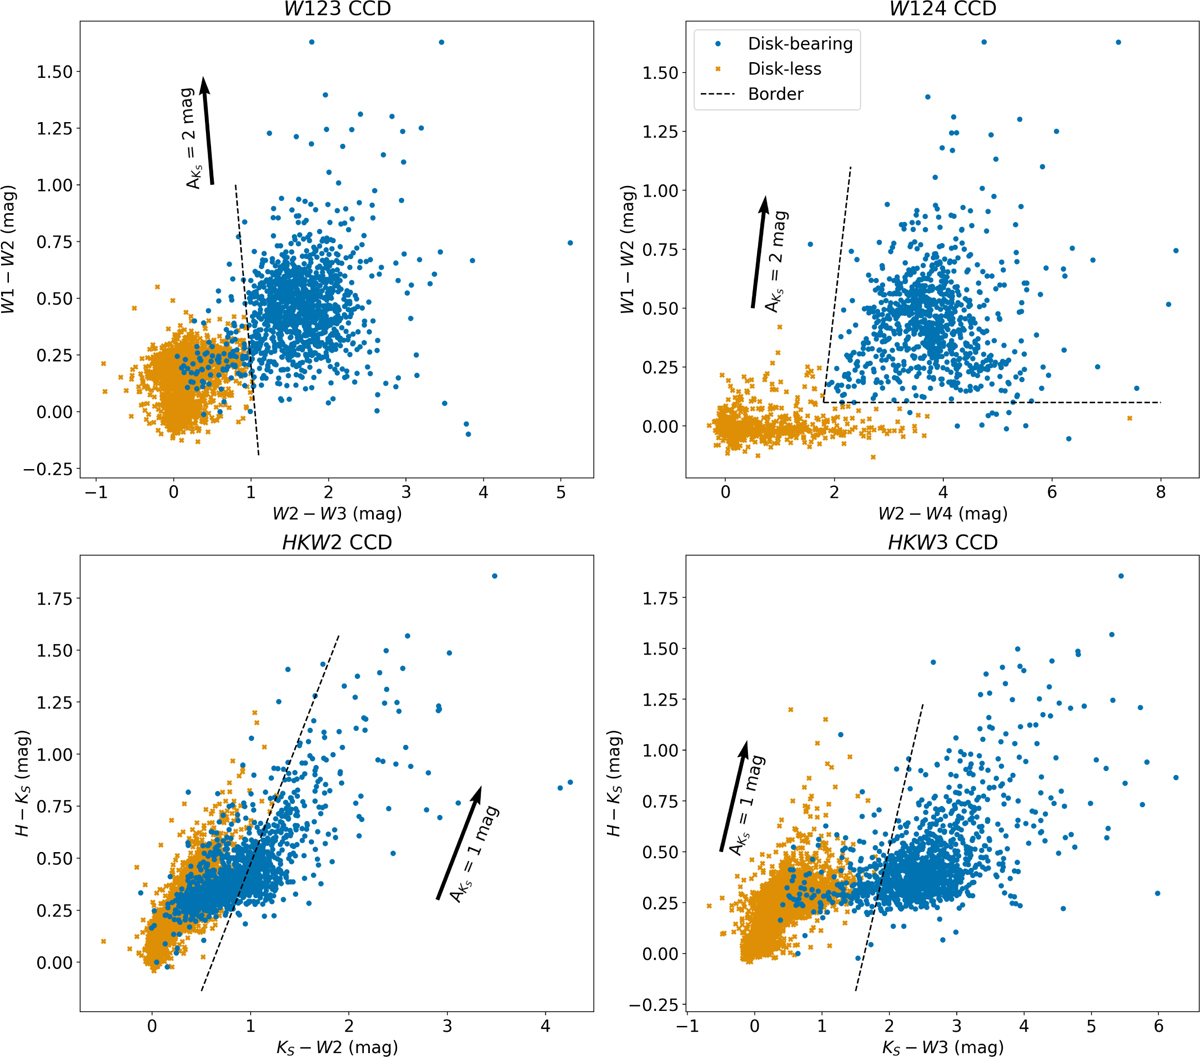
Fig. A.1
Download original image
Selection of disk candidates obtained from a combination of four different IR CCDs. The upper left panel shows the W123 CCD selection (W1 − W2 versus W2 − W3), the upper right panel the W124 CCD selection (W1 − W2 versus W2 − W4), the lower left panel the HKW2 CCD selection (H − KS versus KS − W2), and the lower right the HKW3 CCD selection (H − KS versus KS − W3). In each plot, the blue circles show sources selected as disk-bearing and the orange crosses are disk-less. The borders are the dashed, black lines in each diagram. In each plot, the extinction vector is shown, scaled to a value of AKS given in the plot above the extinction vector.
Current usage metrics show cumulative count of Article Views (full-text article views including HTML views, PDF and ePub downloads, according to the available data) and Abstracts Views on Vision4Press platform.
Data correspond to usage on the plateform after 2015. The current usage metrics is available 48-96 hours after online publication and is updated daily on week days.
Initial download of the metrics may take a while.