Fig. A.4
Download original image
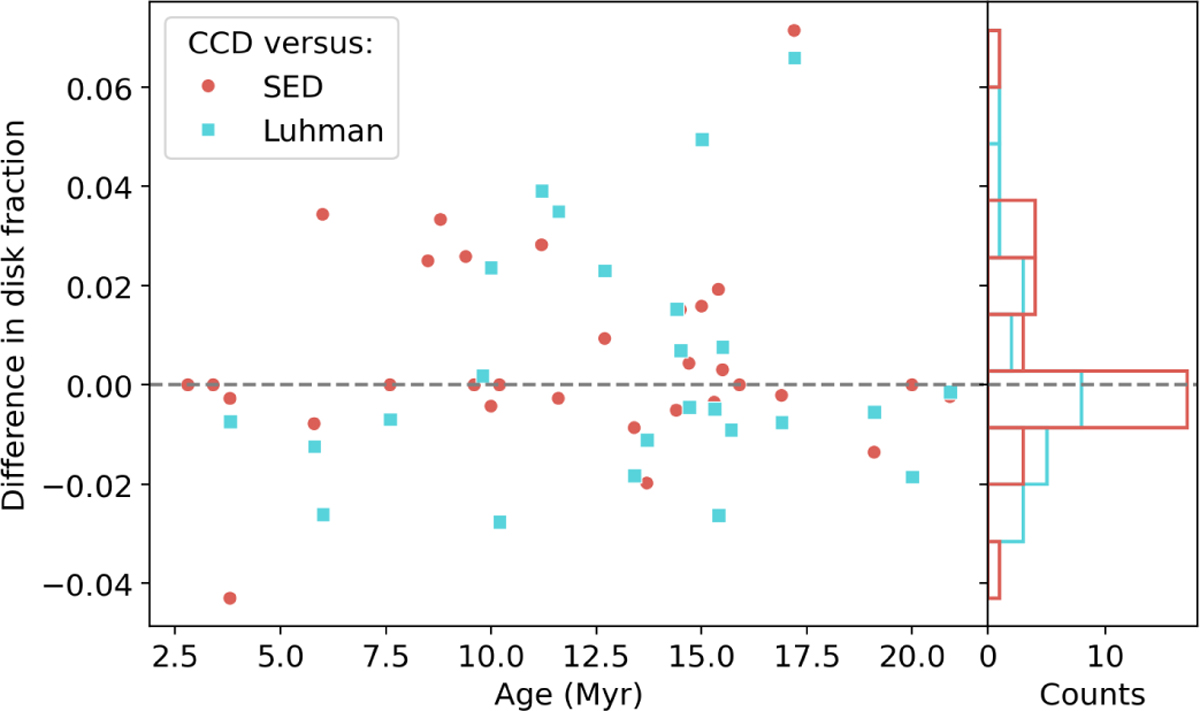
The absolute difference in disk fraction f for the selection using the CCD versus the SED or the Luhman selections, plotted against stellar cluster age. The light red data points are the 33 stellar cluster of the CCD/SED selection and the light green squares the 25 stellar clusters that are included in the Luhman selection. The histogram on the right along the y-axis shows the distributions of the difference for the two comparisons.
Current usage metrics show cumulative count of Article Views (full-text article views including HTML views, PDF and ePub downloads, according to the available data) and Abstracts Views on Vision4Press platform.
Data correspond to usage on the plateform after 2015. The current usage metrics is available 48-96 hours after online publication and is updated daily on week days.
Initial download of the metrics may take a while.