Fig. C.1
Download original image
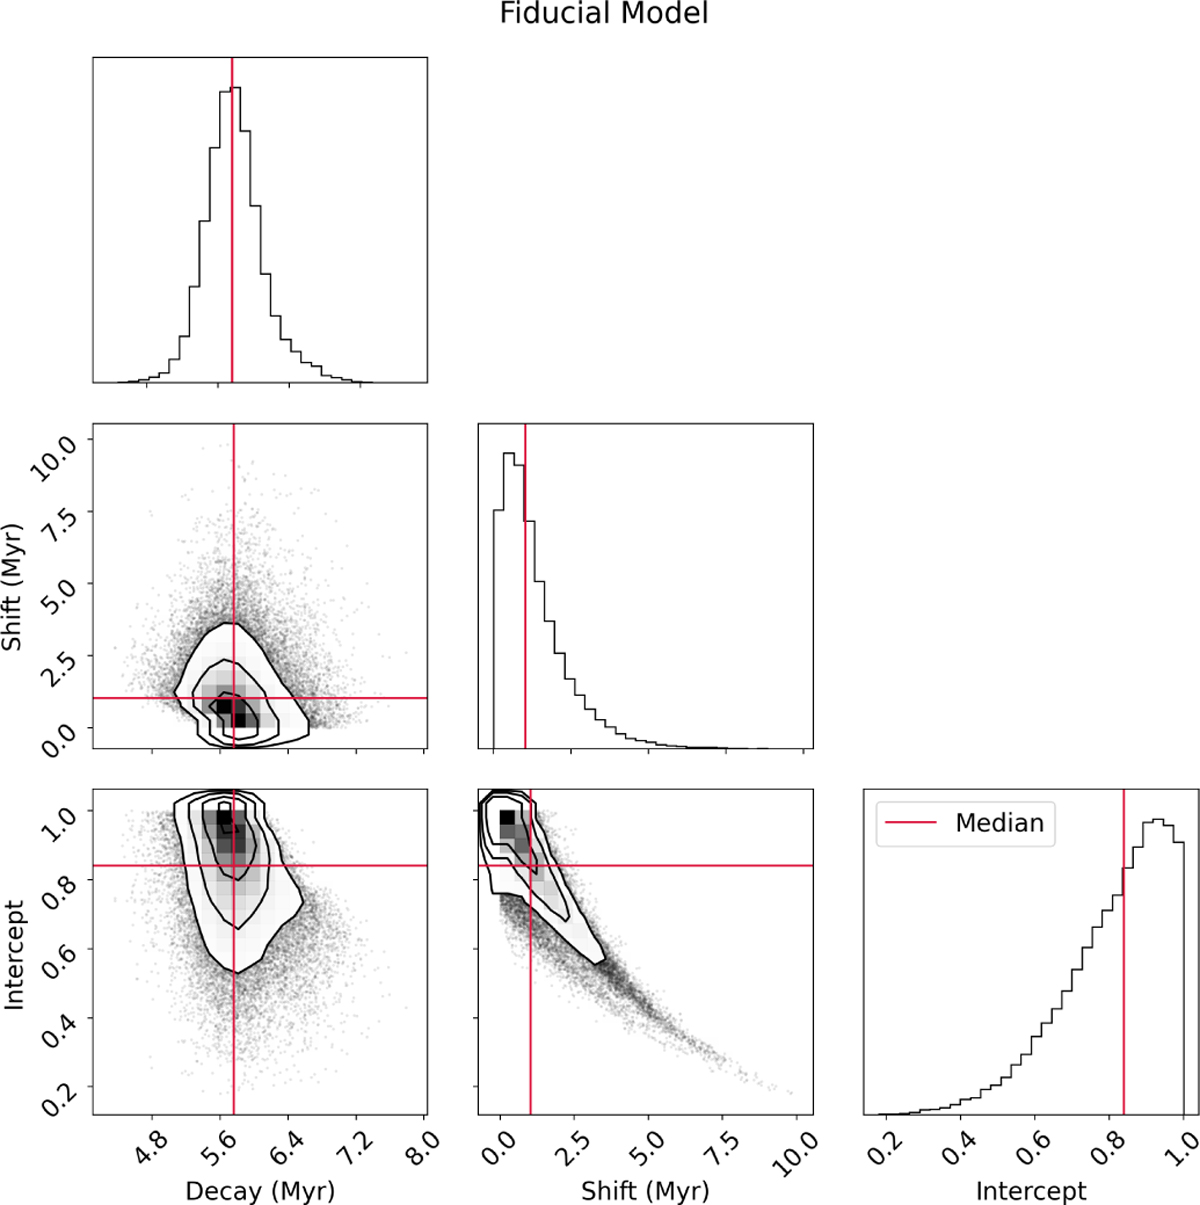
Corner plot of the sampled parameters as determined with the fiducial model (see Appendix B). The left upper panel shows the distribution of the decay parameter τ in Myr. In the second row, the first panel shows the correlation of τ with the shift parameter t0, and the second panel shows the distribution of t0. The last row shows first the correlation of τ versus the intercept parameter f0, then the correlation of t0 versus f0, and finally the distribution of the intercept parameter. The red line shows the median of each sampled parameter.
Current usage metrics show cumulative count of Article Views (full-text article views including HTML views, PDF and ePub downloads, according to the available data) and Abstracts Views on Vision4Press platform.
Data correspond to usage on the plateform after 2015. The current usage metrics is available 48-96 hours after online publication and is updated daily on week days.
Initial download of the metrics may take a while.