Fig. 1.
Download original image
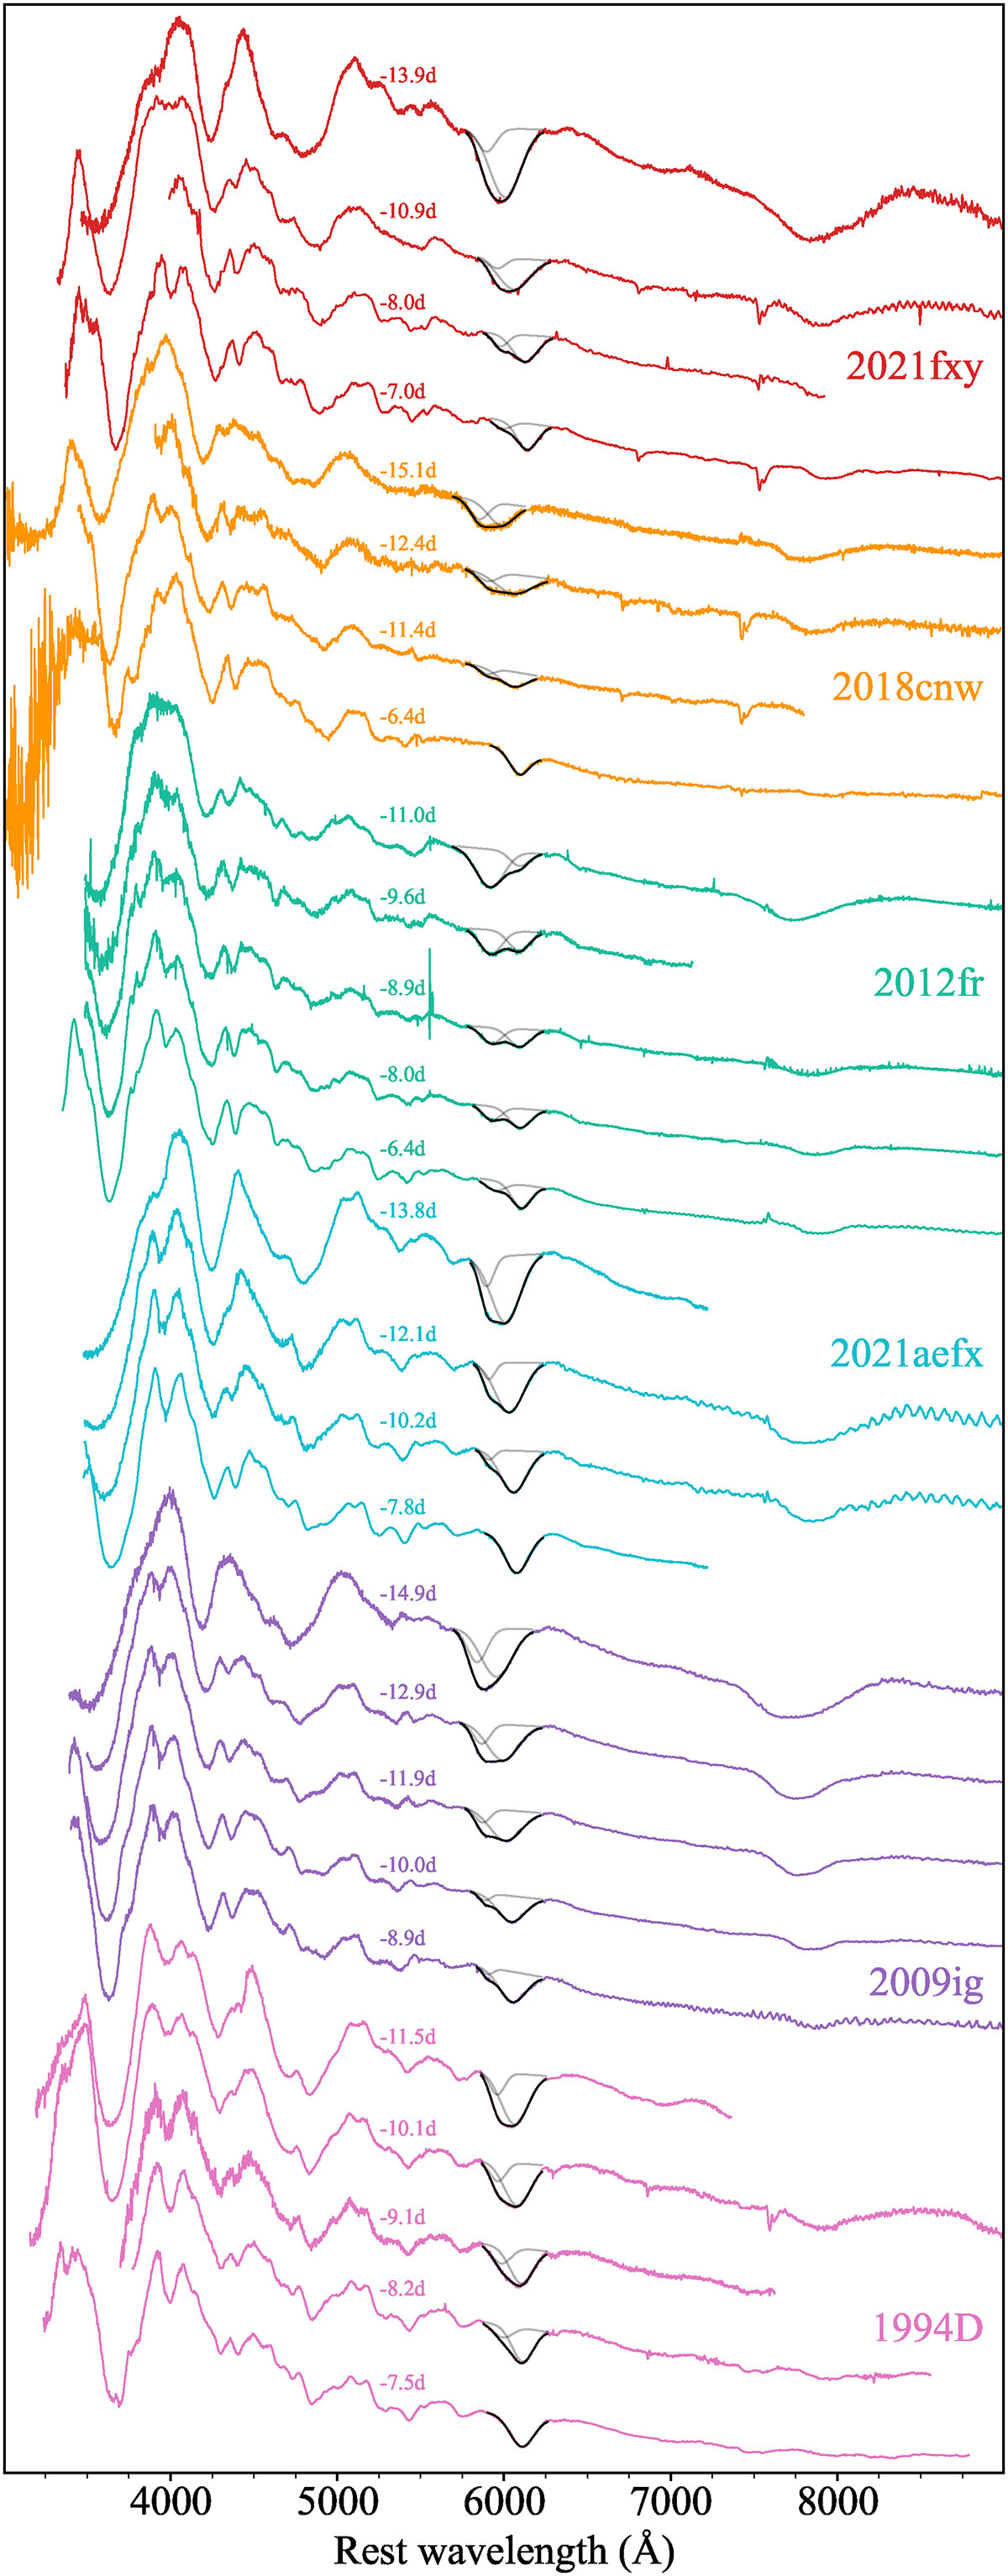
Spectral sequences of the six SNe Ia to be modelled. Fits to the Si IIλ6355 feature are displayed in black for each spectrum. In the case of a preferred two-component fit, the individual components are displayed in grey. The spectra are plotted in normalised luminosity and offset, as is the case with all spectra presented throughout this study.
Current usage metrics show cumulative count of Article Views (full-text article views including HTML views, PDF and ePub downloads, according to the available data) and Abstracts Views on Vision4Press platform.
Data correspond to usage on the plateform after 2015. The current usage metrics is available 48-96 hours after online publication and is updated daily on week days.
Initial download of the metrics may take a while.