Fig. 10.
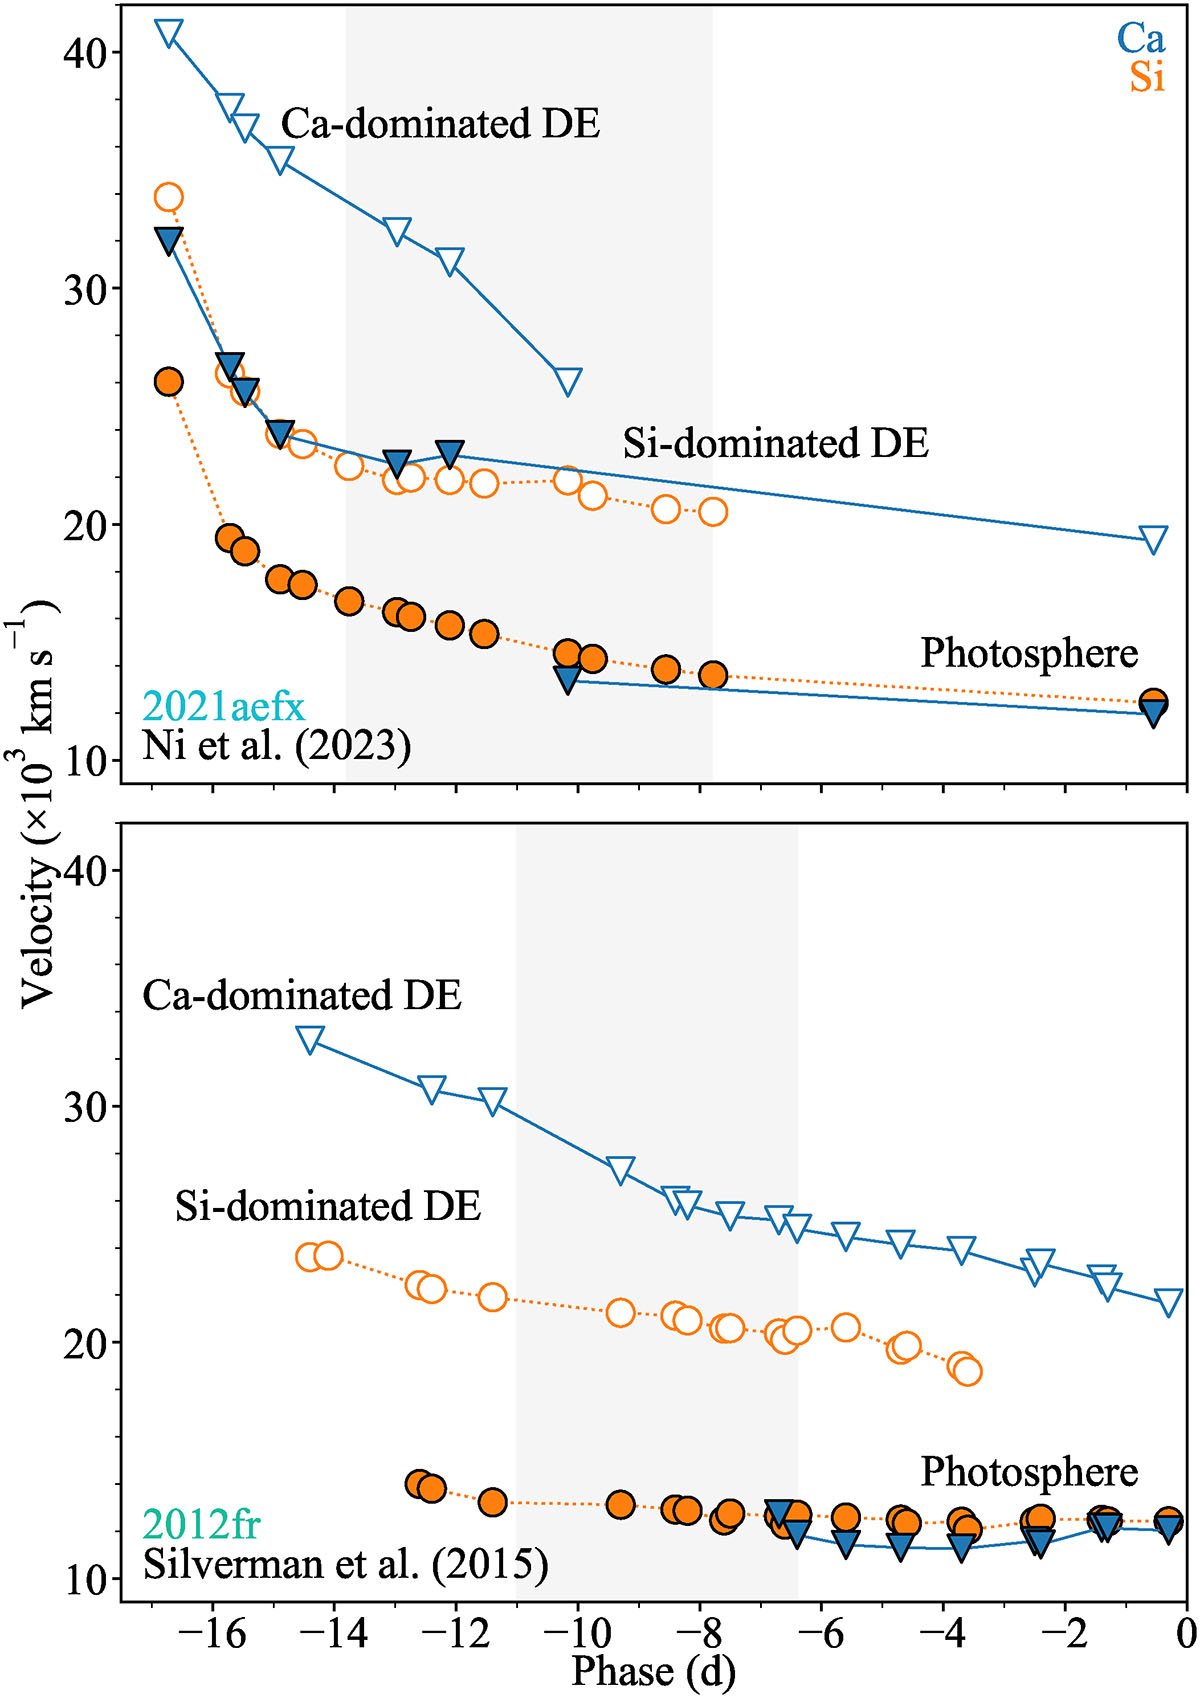
Download original image
Velocity measurements of the PV and HV components of the Si IIλ6355 (orange circles) and Ca II NIR (blue triangles) features in SN 2021aefx and SN 2012fr from Ni et al. (2023) and Silverman et al. (2015), respectively. The open points are components classified as HVFs in the literature; the solid points are those classified as PVFs. The lines join together points that we propose to be forming in the same line-forming regions, labelled as the photosphere, Si-dominated density enhancement (DE), and Ca-dominated DE. The phase ranges covered by the modelling in this paper are shaded in grey. The phases for the SN 2012fr measurements are given relative to the date of maximum used throughout this work, and therefore differ slightly from the values provided in Silverman et al. (2015).
Current usage metrics show cumulative count of Article Views (full-text article views including HTML views, PDF and ePub downloads, according to the available data) and Abstracts Views on Vision4Press platform.
Data correspond to usage on the plateform after 2015. The current usage metrics is available 48-96 hours after online publication and is updated daily on week days.
Initial download of the metrics may take a while.