Fig. A.1.
Download original image
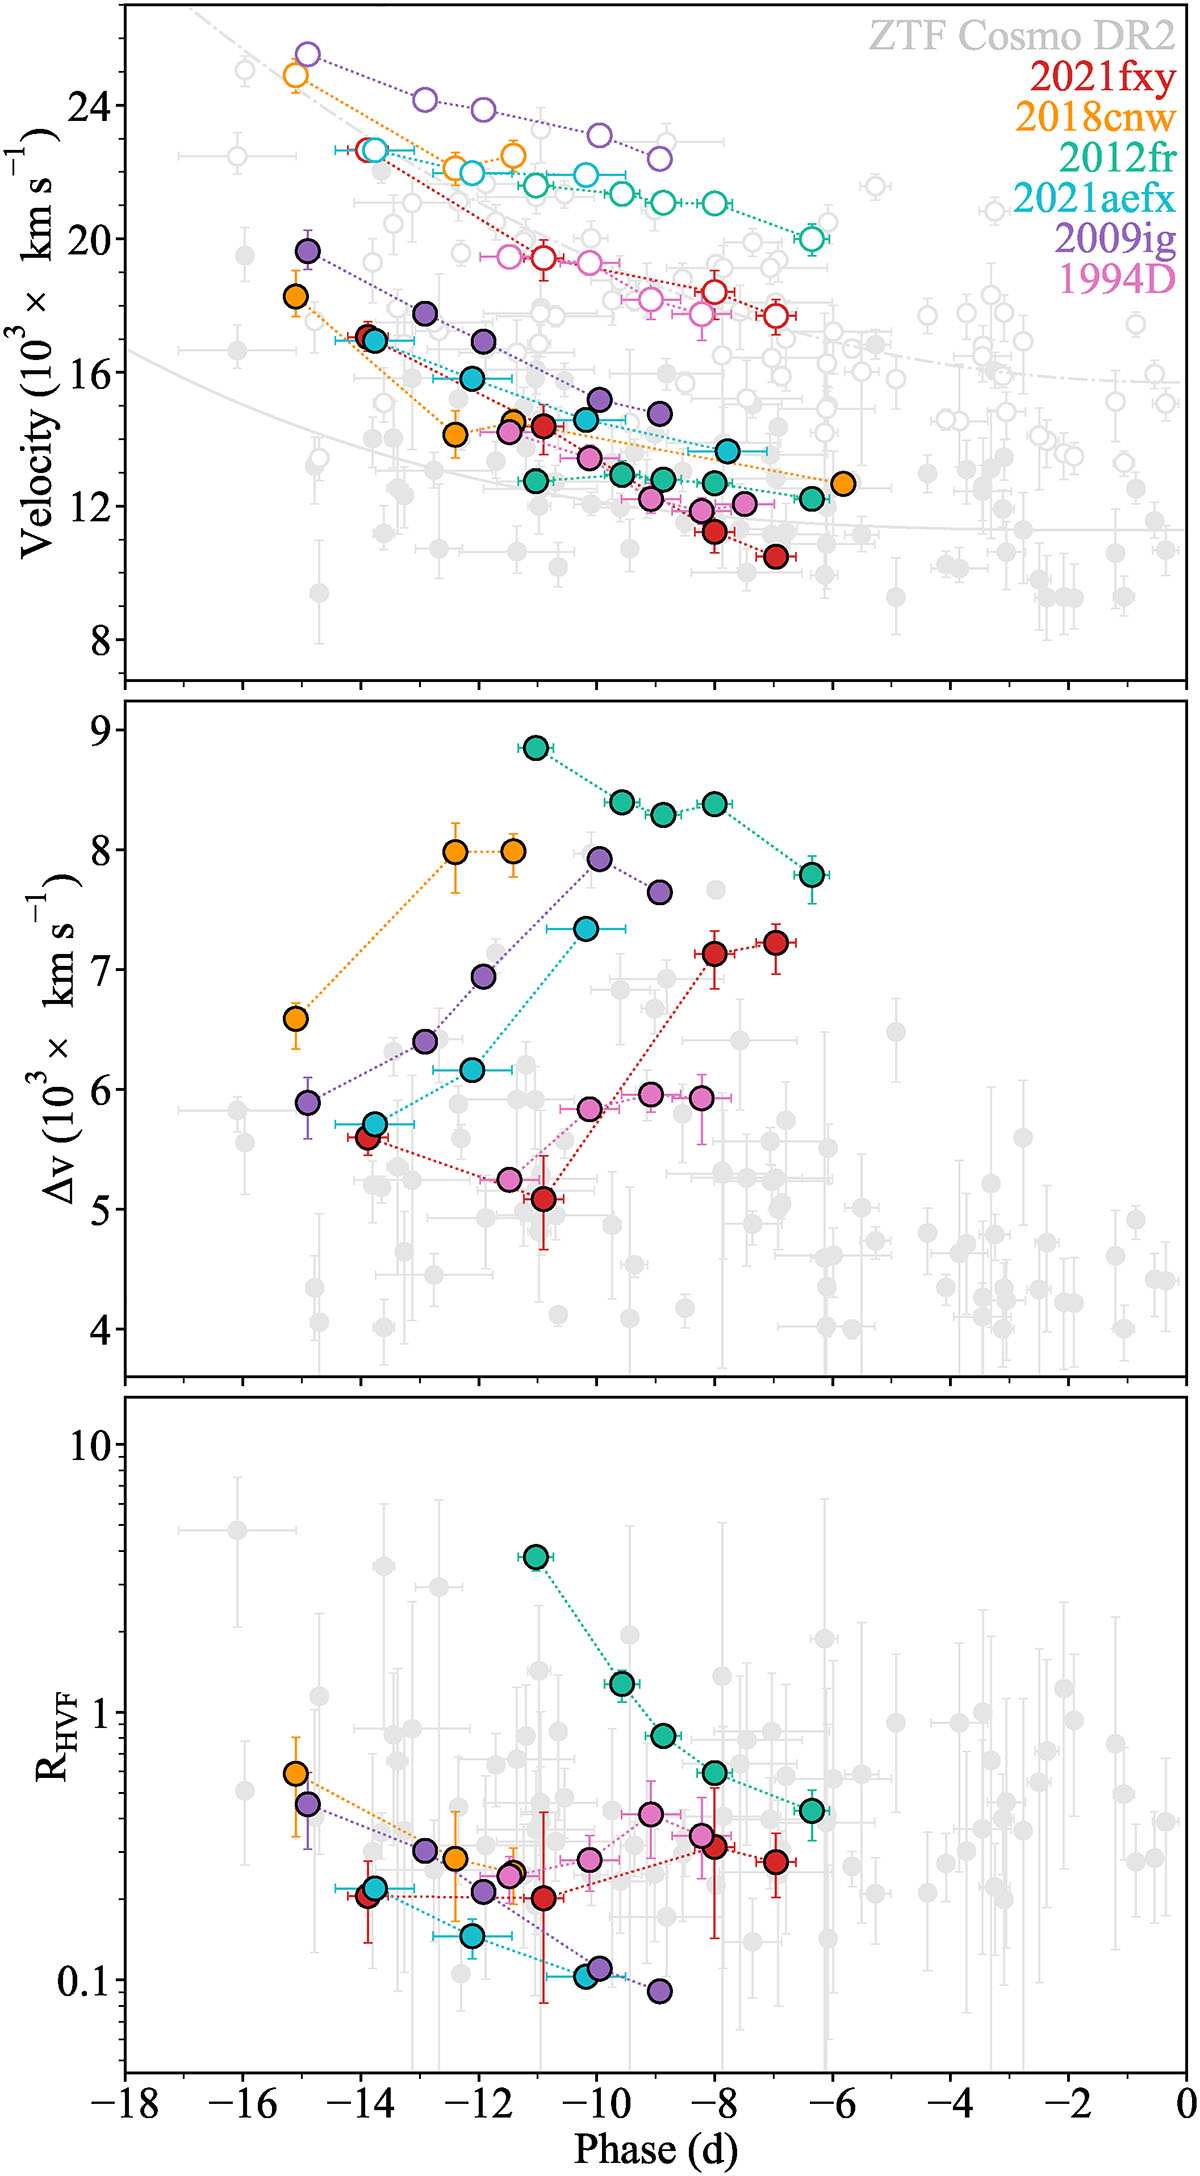
Comparison of the HVF SNe Ia sample collected here and the ZTF Cosmo DR2 HVF sample (grey) from H1. Here we plot the velocity evolution of the PV (solid) and HV (open) components (top), the separation between them in velocity space (middle), and the ratio of their pEWs (bottom). The same code has been used to fit both samples. The colours for each object match those in Fig. 1 and used throughout. The solid and dot-dashed lines in the velocity panel correspond respectively to the fits to the PV and HV components from the DR2 sample (H1).
Current usage metrics show cumulative count of Article Views (full-text article views including HTML views, PDF and ePub downloads, according to the available data) and Abstracts Views on Vision4Press platform.
Data correspond to usage on the plateform after 2015. The current usage metrics is available 48-96 hours after online publication and is updated daily on week days.
Initial download of the metrics may take a while.