Open Access
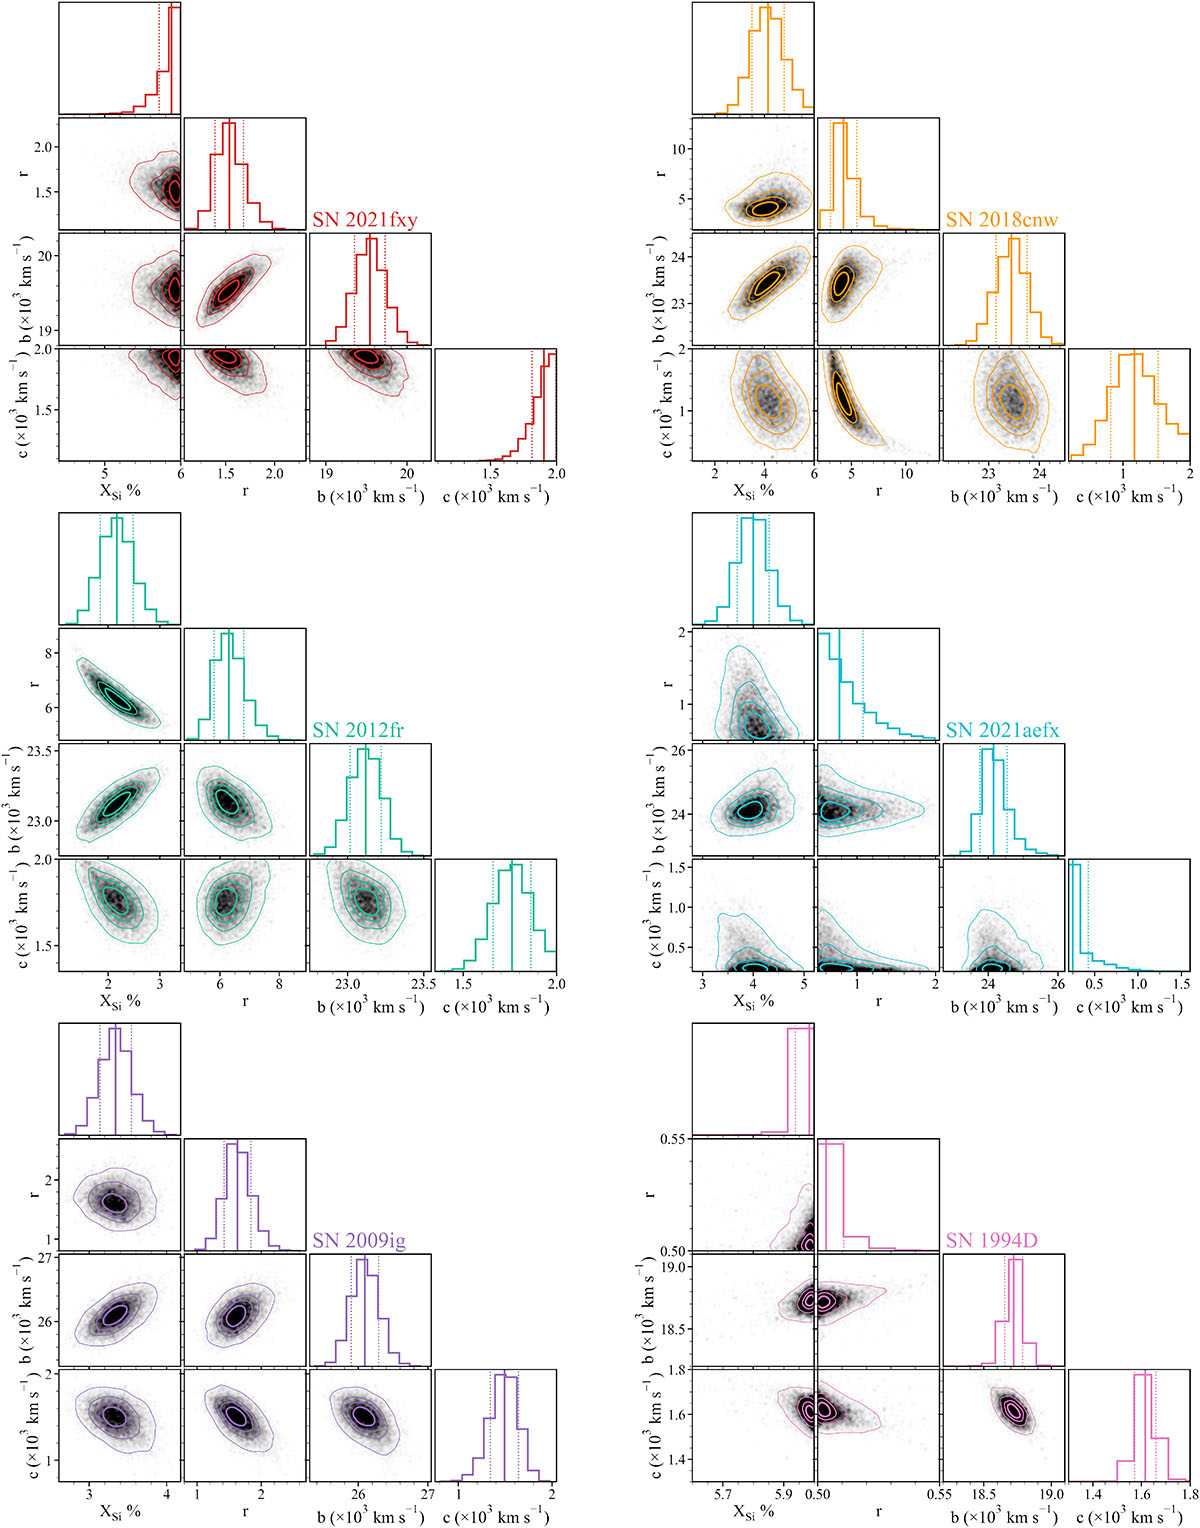
Fig. A.3.
Download original image
Corner plots of the parameter posteriors inferred by the density enhancement MCMC runs for the six SNe. The grid boundaries are indicated as grey shaded regions in panels where they are visible. The solid and dotted lines in the histogram panels correspond to the means and standard deviations, respectively.
Current usage metrics show cumulative count of Article Views (full-text article views including HTML views, PDF and ePub downloads, according to the available data) and Abstracts Views on Vision4Press platform.
Data correspond to usage on the plateform after 2015. The current usage metrics is available 48-96 hours after online publication and is updated daily on week days.
Initial download of the metrics may take a while.