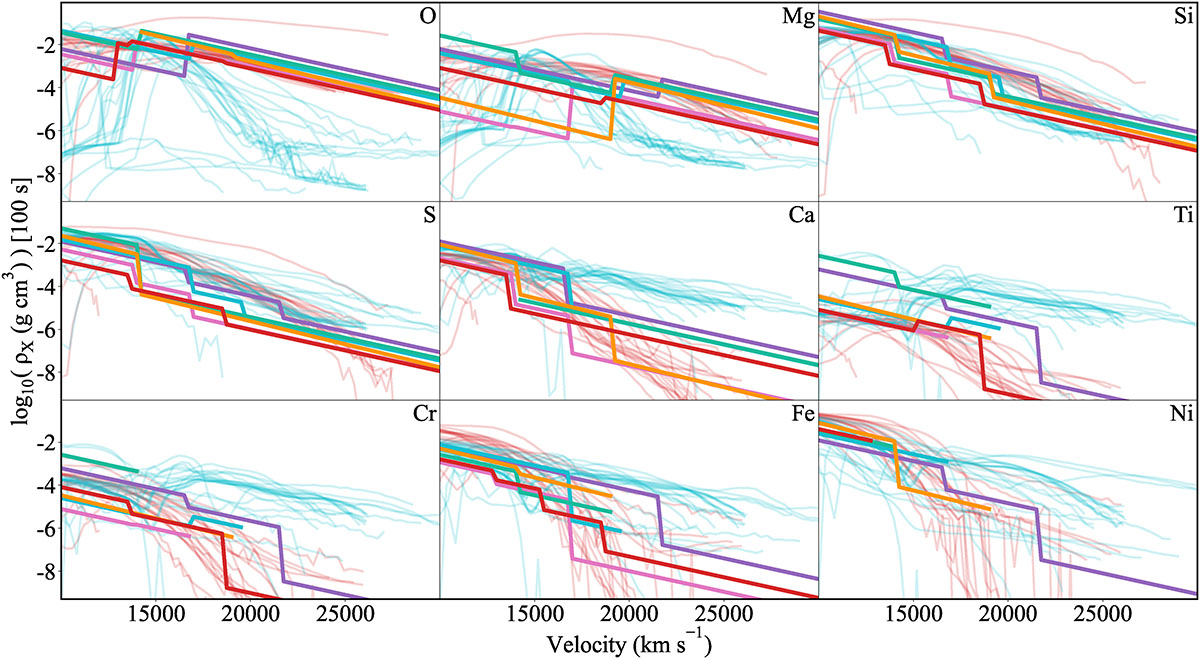
Fig. 2.
Download original image
Species densities for the PV models for the six SNe Ia in our sample. These species densities are calculated as the product of the abundance and density profiles and can be used to compare models with different density profiles. The faint red and faint blue profiles correspond to the HESMA delayed-detonation (Seitenzahl et al. 2013) and double-detonation (Gronow et al. 2021) models, respectively. The colours of the PV model profiles correspond to the colours in Fig. 1.
Current usage metrics show cumulative count of Article Views (full-text article views including HTML views, PDF and ePub downloads, according to the available data) and Abstracts Views on Vision4Press platform.
Data correspond to usage on the plateform after 2015. The current usage metrics is available 48-96 hours after online publication and is updated daily on week days.
Initial download of the metrics may take a while.