Fig. 3.
Download original image
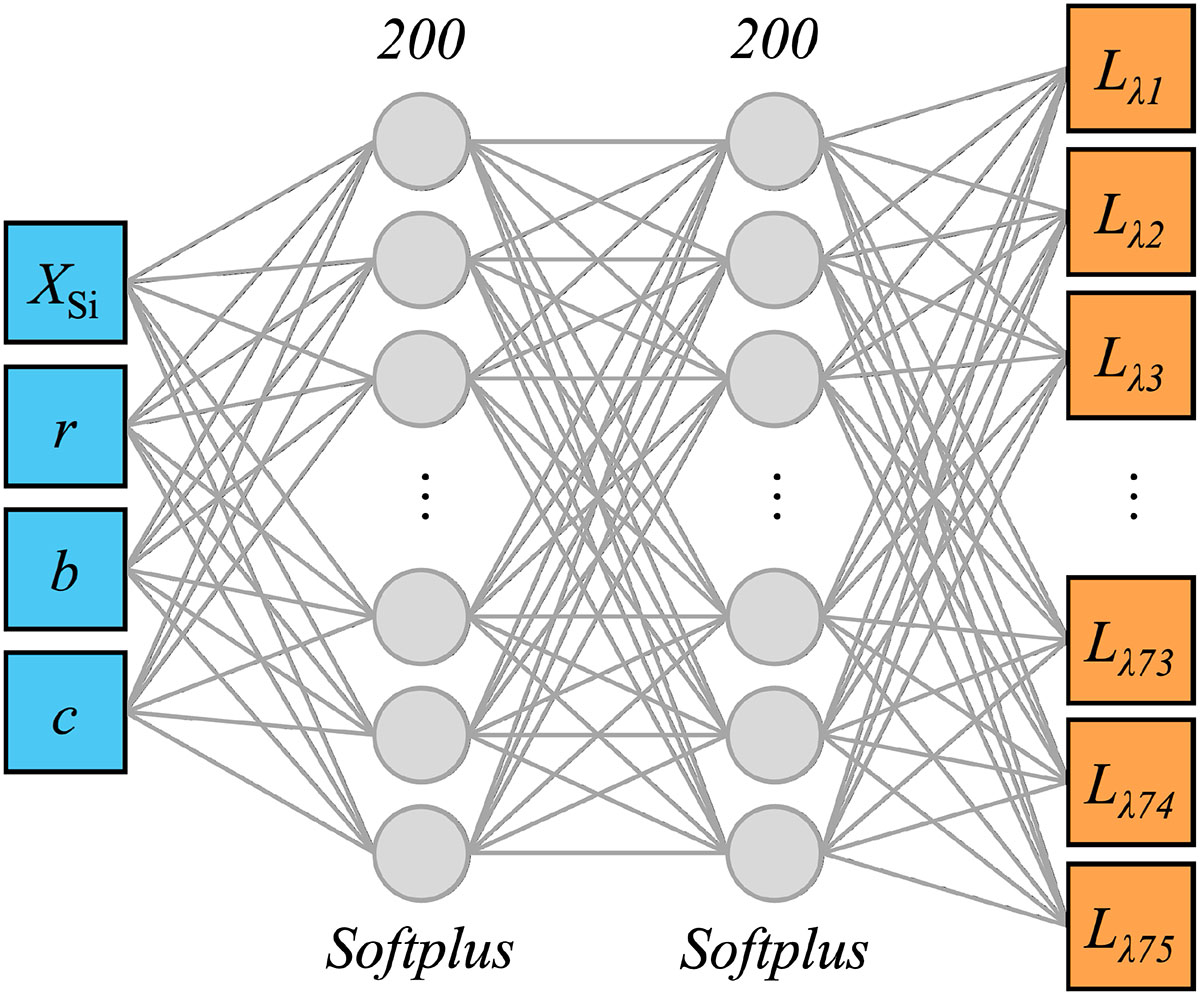
Schematic view of the chosen NN architecture. The blue nodes on the left correspond to the four inputs governing the density enhancement and silicon abundance, which are fed into the input layer. The input layer and hidden layer are both comprised of 200 neurons with a softplus activation function and are represented by the grey nodes. Finally, the orange nodes correspond to the normalised luminosity outputs at the 75 wavelength points across the range of the Si IIλ6355 feature.
Current usage metrics show cumulative count of Article Views (full-text article views including HTML views, PDF and ePub downloads, according to the available data) and Abstracts Views on Vision4Press platform.
Data correspond to usage on the plateform after 2015. The current usage metrics is available 48-96 hours after online publication and is updated daily on week days.
Initial download of the metrics may take a while.