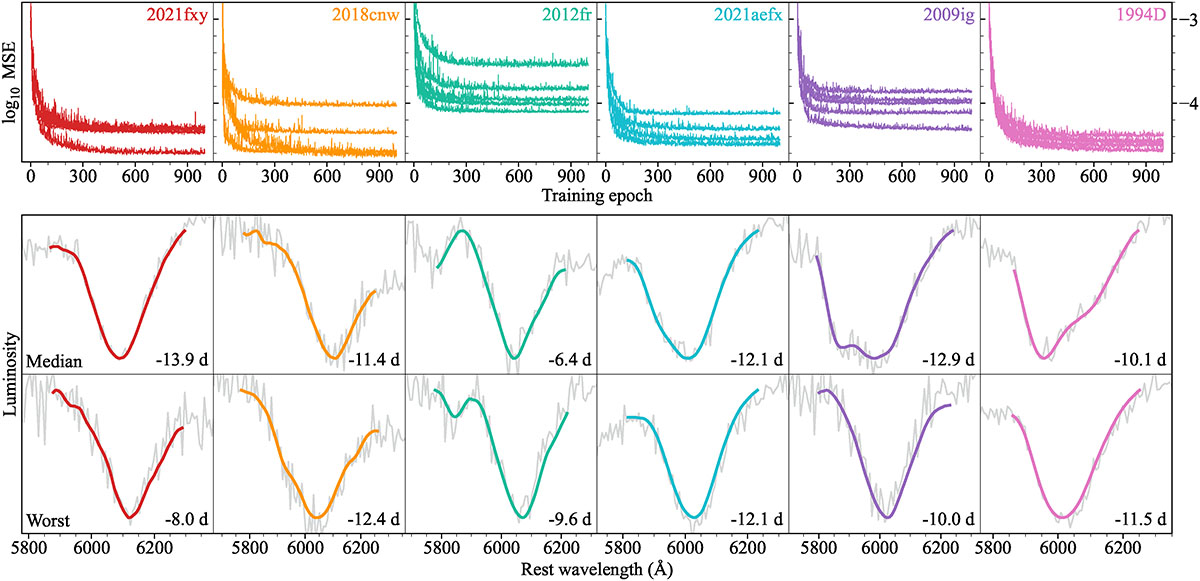
Fig. 4.
Download original image
Performance summary of the 27 NNs (four or five per SN based on the number of observed spectral epochs). The evolution of the MSE is shown against the training epoch in the top panels. The middle and bottom panels show the median and worst-case predictions, respectively, from the simulated test data corresponding to each SN epoch. The grey lines are the unsmoothed TARDIS outputs and the colours lines are the NN predictions. The median and worst predictions are not necessarily at the same epoch for each SN.
Current usage metrics show cumulative count of Article Views (full-text article views including HTML views, PDF and ePub downloads, according to the available data) and Abstracts Views on Vision4Press platform.
Data correspond to usage on the plateform after 2015. The current usage metrics is available 48-96 hours after online publication and is updated daily on week days.
Initial download of the metrics may take a while.