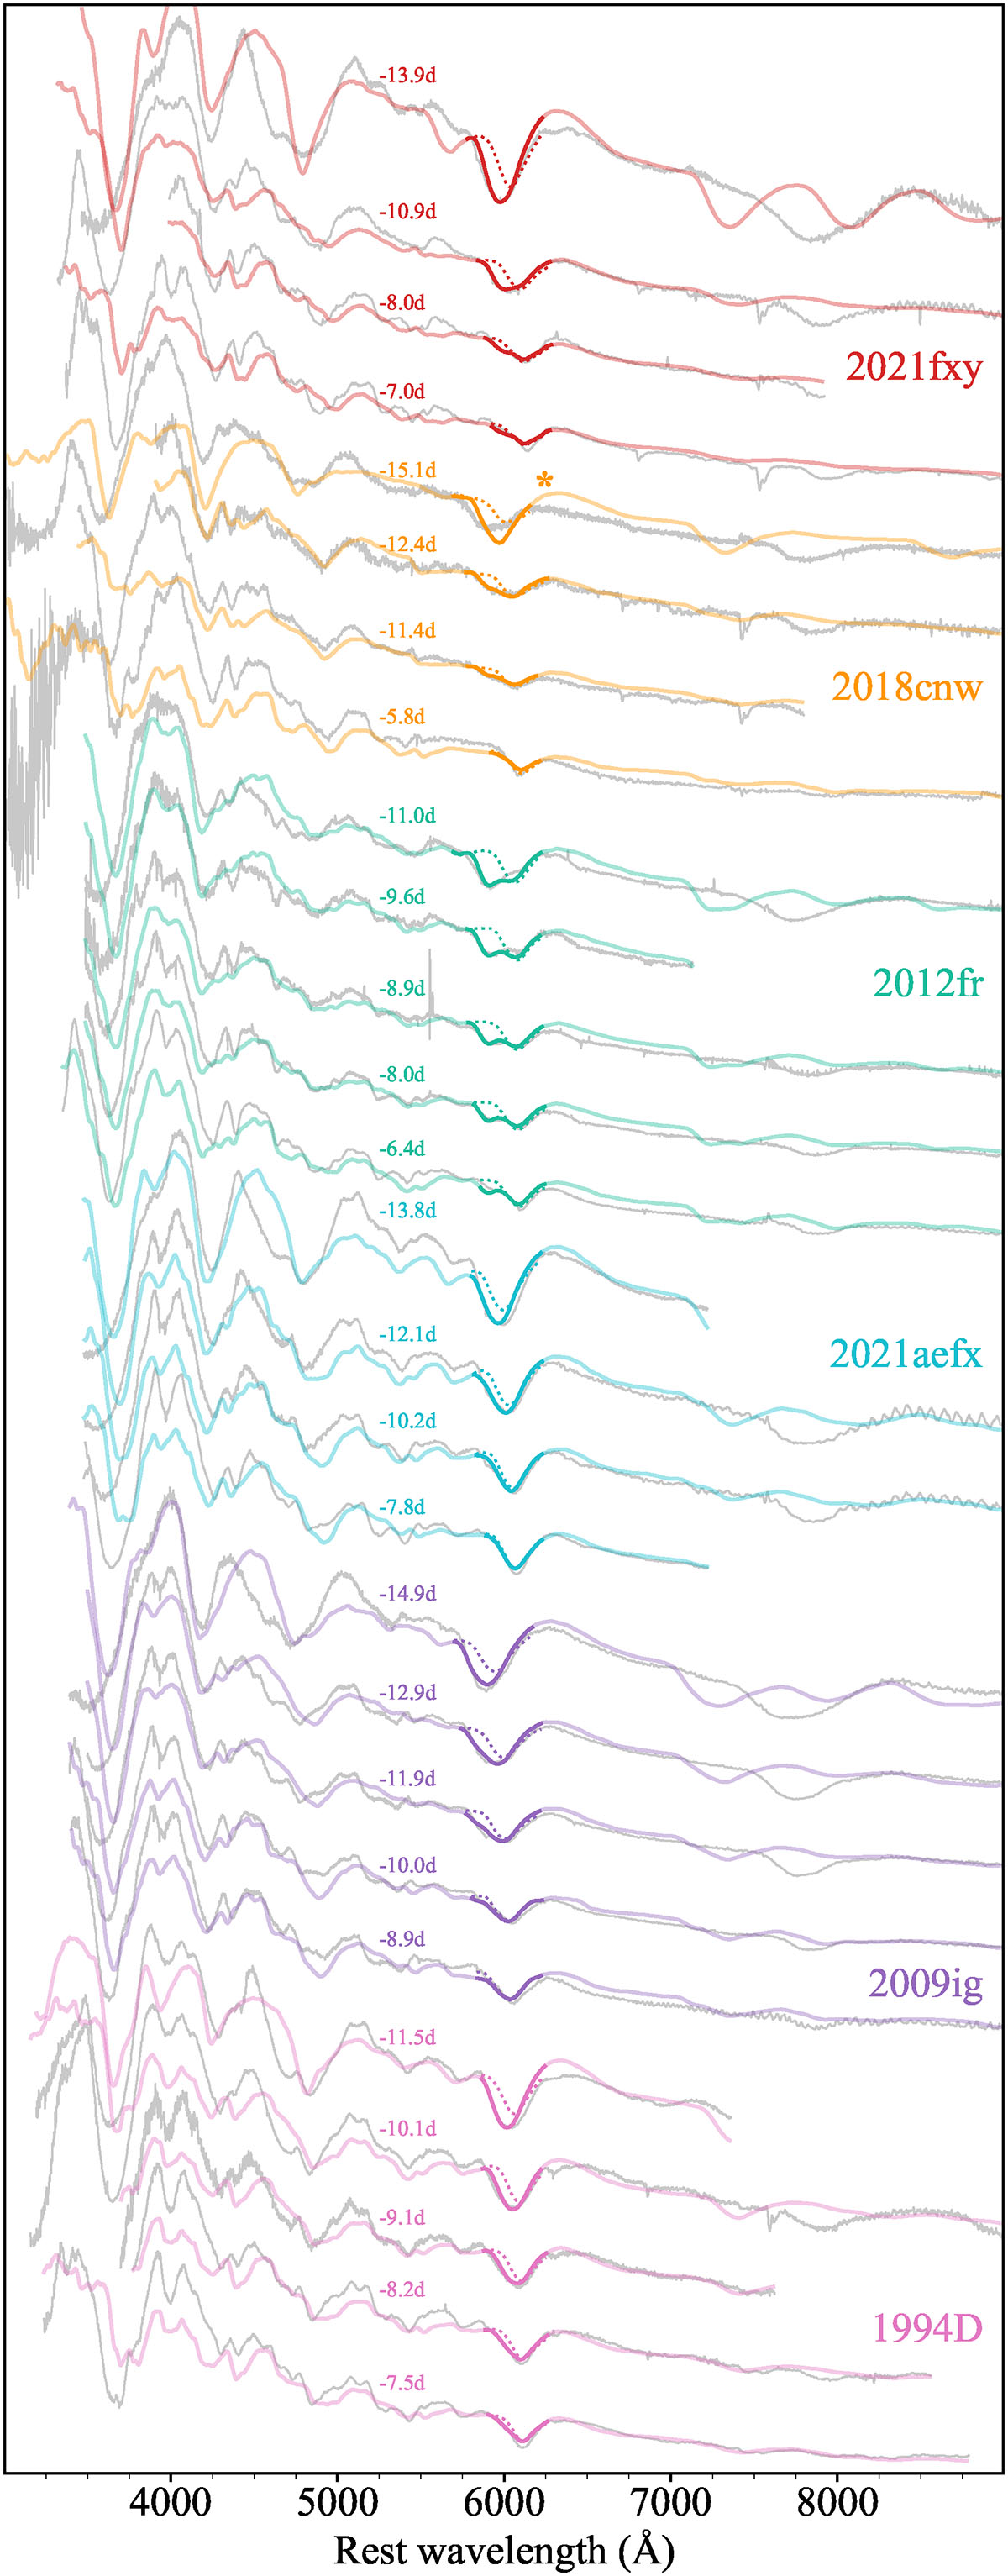
Fig. 5.
Download original image
Best-fitting density enhancement model spectra (solid coloured lines) compared to observed spectra (grey) and the Si IIλ6355 region from the PV simulations (dotted). The faint regions of the model spectra correspond to the regions that are not constrained in the MCMC fitting. The asterisk by the −15.7 d spectrum of SN 2018cnw indicates that this spectrum was not used in the MCMC parameter inference (see Section 3.5).
Current usage metrics show cumulative count of Article Views (full-text article views including HTML views, PDF and ePub downloads, according to the available data) and Abstracts Views on Vision4Press platform.
Data correspond to usage on the plateform after 2015. The current usage metrics is available 48-96 hours after online publication and is updated daily on week days.
Initial download of the metrics may take a while.